원문 보기
Bitcoin will rise while everything else falls. Michael Berry, the hedge fund manager known from The Big Short, has abandoned his bet on falling prices and is now betting on rising ones. The Ultra also currently sees that the money taps are about to be opened with a 95% probability. Risk on. Then gold should fall.
That would be expected, wouldn't it? When the economy is strong, gold and Bitcoin usually decline. And that's exactly what we're looking at in this chart today. But again, folks, this is just my interpretation of the data and not financial advice. If your thumb isn't short, give me a thumbs up and help me fight the YouTube algorithm.
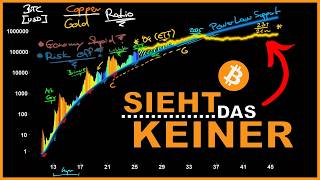
Off to the Scha and of course, folks, of course, yes, of course, it's about BTC in USD, the Bitcoin price in US dollars, here on a scale from 10, 100,000, 100,000, 100,000 up to the 1 million dollar mark, going back to 2011 and forward to 2045. Yes, you see , today we're dealing with a bit of a forecast based on a model.
I'll get to it in a minute, guys. I'll get to it in a minute. You definitely have the Bitcoin price here over time. You can see it, of course, on the pillars, on the pillars that are above the so-called Power Law. Yes, this blue line is the Power Laws Support, which spirals upwards over the course of the years and describes the time periods at four-year intervals below .
Yes, 2013, 2017, and 2021 were also years with bull markets, and definitely 2025, yes, we can't deny it, things are going relatively well, or this year 29, 33, and so on. That means the power curve winds its way upwards here, or rather, it rises steadily, and on the other side, the Bitcoin price sits on top of the power curve, and then of course there's another color, and you can already see the color, which is always red and then blue again, and red and blue.
One might think, yes, that's like a heating process, right? It's hot sometimes, sometimes it's cold, sometimes it's hot sometimes it's cold. I'll tell you what it is. It is the so-called copper-to-copper ratio, or copper-to-gold ratio, we should say. So we have copper on the top side, and there is a ratio; it's a ratio of copper to gold.
I didn't actually want to include it in the chart here, but someone emailed me – I think I can remember their first name, Mika – and they brought up this copper to gold ratio, suggesting I take another look at it . This means that, once again , we tend to focus more on gold, economic growth, or M2, but the Copper Gold Ratio combines both very well.
So, the M2, the money supply, but also economic growth, but also risk aversion with gold and so on. So, we have represented this in color here . That means if the copper-to-gold ratio gets pretty hot, if it runs hot, yes, and by that I mean the economy, yes? So, when the economy is overheating, we move into this reddish range.
This means that whenever we are in the red, the economy is overheating. This is measured by the fact that the price of copper is rising, and indeed rising disproportionately to the price of gold, i.e. extremely high in comparison. This means that copper demand is high. Copper is needed everywhere in every industry, be it for cables, infrastructure projects, cars, circuit boards, or whatever else .
So, copper is found in almost everything, sometimes more, sometimes less, and accordingly, copper is such an economic indicator. On the other hand, we have gold, right? When gold rises in price, this ratio naturally goes down. Yes, so here, if the lower part rises, the entire ratio goes down and then we go into the blue area.
Oh no, that 's not blue. No, that's not blue. This one is blue. Then we move into the blue zone, and there it's naturally "risk off." Yes, risk off. The economy is cooling down. On the other side, red says Economy Stupid. On the other hand, risk off. Yes, so we're moving away from risk. Basically, it's not a good economic time right now, and you can see that very clearly .
That was here, here, and yes, here we were in the greenish area. But I think you can imagine it: when we move from red to orange, to yellow, to green, to blue , then we're off. And when we then move into the red zone , we're risk on. So here, here, here and here. And as you can see , the Bitcoin price correlates with it.
Yes, that's nothing new. We've heard this many times before: when the economy is doing well, when the stock market rises, Bitcoin rises. This is nothing new, we know that. We are currently entering a slightly different phase, but that's something for analysis. We still need to finish explaining the chart.
So, we see the Bitcoin price, we see the Paula Support, and we see something golden up here. Yes, and because it fits so well , I thought I'd include the Gold Market Cap here. And that was something I had actually already discovered before. Gold Market Cap. Specifically, if you divide this Gold Market Cap by Bitcoin's 21 million.
21 million, then you arrive at this trend, looking back from 2004. Yes, so I'm taking this starting point, namely the latest data, currently, now, now, and I'm using the data from around 2004 for the gold price. And why 2004? because that's where the ETF, the ETF, the gold ETF came into play. That is, I want to examine, using this ongoing gold market cap divided by 21 million, how the Bitcoin price would develop based on the properties that gold had after the ETF was introduced.
Yes, because we now have the introduction of ETFs and the question is, does that change everything? Does this ETF introduction change everything? Yes, that's quite possible, and that's precisely my point . That means we basically have, so here at the last point, that's current, yes, even a little higher, yes, but I 've only drawn it up to 2045, so let's do it right, let's do it right.
Yes, we're already above the $1 million mark if we divide the market cap of gold by 21 million, because we're currently at, well, what is it, 23 trillion. Trillion in English, yes, trillion divided by 21 million. Yes, and that 's roughly the current price if you divide the gold price (Capt) by the 21 million Bitcoins.
Of course, this is only theoretical, yes, but you can see that the course would develop very differently than we would currently assume for the Bitcoin price. Now, before we get into the analysis, folks, let me reiterate that I love black espresso without sugar. I need the stuff for these charts. Yes, that stuff makes me so incapacitated that I can spit out stuff like that.
That's why the coffee fund is set up below for 99 cents, also works via Lightning. Yes, so either membership value or Lightning, like Michael, Tom, Flo or more recently Sebastian. I want to bring together 100 members and then I'll do something in the members' section exclusively for the video, not charts, but something else, something private, so please please please support the members' section below.
This channel is sponsored, meaning it's financed by donations. Okay, let's continue, folks, now we're getting into the actual analysis, and what am I getting at? Yes, you can see it here . We see boom and bust cycles, which we see via the copper to gold ratio, and this correlates with the Bitcoin price.
So far, so clear. But we also see that things are changing. While the copper ratio was very high here , something is now changing. Yes, as you can see, we're already in a bull market, or at least that's what we think. On the other hand, we're still quite cool, we're still blue, we're still risky, at least as far as the copper to gold ratio is concerned.
Yes, we are still risk-off from the copper to gold ratio, and therefore the idea is that Bitcoin is now transforming from a copper-based gold ... Yes, and whenever the economy is strong, Bitcoin rises and transforms into a risk-off asset. Yes, risk-off asset in the sense of gold and in the sense of hey, we're going up the price even though the risk is off.
So something is changing here now, and there are various assumptions about it. That's certainly possible, that's certainly possible, that Bitcoin is currently undergoing a transformation. But it could also be, folks, it could also be that it has something to do with the additional liquidity via the ETFs, and that's why here's the continued chart.
That's why we're showing this gold price, or rather this gold Bitcoin price, which illustrates how, when the ETF was introduced, gold was already an ancient asset thousands of years old when the ETF was introduced, experiencing a gigantic bull run. Yes, here for years and years. And Bitcoin could experience something similar, because liquidity is entering the market, specifically through ETFs, funds, and institutions that have found a way to invest in Bitcoin.
So, besides the assumption that Bitcoin is switching from gold to copper, it could be that Bitcoin is actually just experiencing extremely high liquidity , which represents market access. Yes, ETFs are a new way to access the market. We've had other market access points in the past, but the ETF is a new market access point and is bringing in money, even though we don't even see that classic copper moment yet, even though the actual economy is still weak .
Yes, folks, so here's the summary. I'm writing this again because you're probably thinking, oh God, oh God, oh God, what is he trying to tell us? The Key, the Key Takeaways again, folks. Yes, the Key Takeaways. I want to tell you, or rather, this is what I want to tell you. First point, there are three points again.
Key Takeaways. Bitcoin behaves, or behaved, like copper. Hopefully, that's clear to us. Yes, we hopefully understand that. The price of copper symbolizes the strong economy. Red indicates that Bitcoin is strong when the economy is strong. Okay, so far so good. That should be clear to everyone. But that also has something to do with liquidity .
Sinsen the zinc Sinsen the zincs. No, interest rates are falling. When interest rates fall, companies essentially have a better opportunity to access cheap money . The money supply increases, the economy grows. Yes, that's basically the connection. That's nothing surprising. This should come as no surprise, and Bitcoin behaves similarly.
When interest rates fall, the money supply increases, more liquidity flows into Bitcoin. Okay, so far so good. Functions. The second point is actually that now, now, now we are behaving more like gold. Strangely enough, we are currently negotiating more like gold. More like gold. The Bitcoin price, although we are currently in the green and blue zones, has already risen, has risen very significantly .
We only experienced this once, and it was actually here, yes, here in 2018/19, yes, when the Bitcoin price rose extremely from its low , even though the liquidity wasn't so great yet, even though the economic strength wasn't so great yet . Yes, maybe it's just a moment, that's quite possible, but actually it's always up and down, up and down, up and down, up and down in a four-year cycle.
Yes, that's why you 've recorded the four-year cycles down here, again and again, every four years. Yes, so now we're moving more like gold. This can have several reasons, but one of them is that the new liquidity, the liquidity created by the ETFs, is currently changing Bitcoin. Yes, so this could change everything, and we could take this gold chart, and this is not fake, guys.
Yes, so if you divide the gold market in 2003/2004 by 21 million, you'll get roughly the price where we are now. And that's why it's so nice for comparison. And we set it up and see that it keeps going higher and higher because this liquidity came into the gold market through ETFs, and now for over 20 years, so until 2045, and here from 2005 to 2025 roughly, yes, because all of this brought so much liquidity into gold that an incredible rally was triggered, and it fits together perfectly, even with the power support, but you can also see that at some point the power law support breaks, it breaks through in the back, yes, around 2034, 2035, let's say roughly.
Yes, these are all just estimates. And here, in 2035, the Power Law support breaks, and you know that Power Law is just a model for essentially logarithmic or exponential growth on a lockscale, and at some point it will break. Yes, and here's the assumption that in 10 years it will happen, it will break and gold or Bitcoin will experience an enormous surge in liquidity by then, and of course it seems totally unrealistic to some, but gold, gold, gold has indeed started on this path.
Gold behaved in the same way as the ETF. Why should we assume that this is so unreal ? That's certainly possible. We adhere to the four-year cycles here in the chart as well . Me too, here at the canal. Yes, I 'm actually a fan of these four-year cycles and I keep saying that I think we'll reach our peak in the next quarter or the one after that .
But what if not? We must constantly remind ourselves that things can be different, that we can keep this gap to power support very far away for a very long time, and that we will experience a very big rally over 10 years. Over 10 years simply because this ETF brings in liquidity. Yes, folks, that's a theory.
This is a theory, and of course it's just a new perspective on things. We'll do that here in the canal. Some people say, "But you said , guys, I'll show you 1000 different Pozl parts." You have to assemble it yourself. I am not offering financial advice here. These are just data analyses, but this is one more thing.
There is one more thing. Guys, there's one more thing I want to tell you. Take a look at this. It's always about liquidity. Mount Gox was located approximately here. Mount Gox was a stock exchange. Mount Gox brought liquidity and new possibilities to Bitcoin, namely how to buy Bitcoin. Completely new possibilities.
Then in 2017 it was Binance. Binance, oh, not very well written, but I think you can read it. Binance. And Binance brought in extreme liquidity. Mount Dogs is a stock exchange. Binance is a stock exchange. Here we had the institutions, the institutions, the institutions brought a completely new perspective to things in 2021.
Tesla came in. Yes, somehow the first companies have invested in Micro Strategy and so on. Yes, what if these cycles , like this ETF that's been here for over a year, are nothing more than liquidity pools? And that's regardless of what we've always thought. We always thought it was due to quantitative easing.
Money is flowing in, an extremely large amount of money is colliding with Bitcoin, driving Bitcoin, the M2 money supply. On the other hand, it might be precisely the liquidity injection, the injection of liquidity. And this injection of liquidity cannot simply come from printing money, from low interest rates and therefore risk on.
No, he can also get away with it by having new vehicles that propel us to the top. And that's precisely the ETF, and this time it came before the issue that there was actually a flood of money. And now let's add quantitative easing to the mix. Q, yes, let's add that here as well . Then, if both things come together, this scenario is no longer so unrealistic.
But let me know what you think in the comments section below . Otherwise, as always, folks, if you liked this German account, give it a thumbs up, subscribe to the little bell, and never help in the fight against the YouTube algorithm. Otherwise, you'll see that and I'll tell you more in the next module.




Comments 0