
저자: PeterSchiff · 외국인
요약 보기
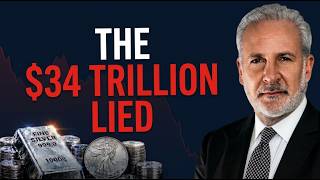
국가부채 4조 달러 돌파 등 재정 적자를 근거로 금·은 가격 조정은 약세가 아니라 통화 희석에 따른 구조적 상승 전 조정이라고 주장. 2008년 금 32% 하락 후 3년간 178% 상승 사례를 예로 듦. 단기 금리 전망보다 재정 확대와 중앙은행 금 매입이 장기 원동력이라고 봄. 투자 조언이 아니라고 명시.
다듬은 글
If you've been watching the financial news lately, you've probably noticed headlines shouting about short-term market drops, interest rate debates, and daily percentage swings in stocks and bonds. But, almost everyone commenting on television is missing the forest for the trees. They are treating every little wiggle in the market as a standalone event, as if the entire global financial system resets itself every single morning.
Let me tell you why that mindset is so dangerous. For years, the official narrative from Washington and central banking institutions has been simple. Inflation is under control, the dollar remains the undisputed king, and economic growth is stable. Yet, if you look past the polished press releases and examine the actual math of government borrowing, national debt milestones passing $40 trillion, and persistent budget shortfalls, a completely different reality emerges.
The By the end of this video, you'll understand why seasoned economic commentators like Peter Schiff argue that the current price pullbacks in gold and silver aren't a sign of weakness. They are a classic historical echo of major financial resets. Not as a guess or a short-term trade tip, but as the inevitable mathematical outcome of decades of monetary dilution.
Before we go further, tell me where you're watching from and whether you think official inflation numbers reflect your everyday grocery and utility bills. I read these comments because I want to know how real people are experiencing this economy away from corporate statistics. To understand why gold is behaving the way it is right now, we have to look back at how major market cycles actually play out.
Most retail investors panic when they see a sharp correction following a massive run-up. They think the bull market is over, but history tells a very different story. Think back to the early months of the 2008 financial crisis. Back then, gold experienced a sharp, painful drawdown, crashing roughly 32% as liquidity dried up and panic swept across all asset classes.
To anyone staring at the red numbers on their screen at that exact moment, it felt like the end of the world. But, what happened right after that flush out? Once the market bottomed, gold didn't just recover. It went on a massive multi-year surge, climbing nearly 178% over the next 3 years. Now, look at where we stand today.
Following historic highs earlier in the year, precious metals have gone through a routine, albeit brutal, consolidation phase and pullback. Analysts who measure things purely by next week's headlines look at this correction and call it a top. But, if you understand monetary history, you realize that every major bull market in real assets shakes out weak participants before the next structural leg higher begins.
The mainstream media loves to tell you that gold and silver move exclusively based on what the Federal Reserve does with interest rates next month. If rates stay high, they claim precious metals must drop because they don't pay a yield. It sounds logical on paper, but it ignores the primary driver of currency devaluation, reckless fiscal spending.
Consider what happens when geopolitical tensions flare up, conflicts expand, and governments borrow trillions of dollars to finance operations, replenish strategic stockpiles, and manage domestic deficits. Even if a conflict cools down temporarily, the debt has already been created. The money has already been spent into existence.
That creates a permanent structural expansion of the money supply. When a government prints and borrows capital on that scale, the purchasing power of every individual dollar unit degrades. Central banks across the globe understand this mechanics deeply, which is why international central bank accumulation of physical gold has continued at record paces over recent years.
They aren't looking at weekly interest rate projections. They are looking at long-term geopolitical and monetary survival. This brings us to the most important part of the entire equation, human psychology. Markets are ultimately driven by people and people are biologically wired to react out of fear when prices move violently in either direction.
When an asset runs up rapidly, people feel the emotional pull of FOMO, fear of missing out, and buy near the peak because everyone on social media is celebrating. Then when a standard 20% or 25% correction hits, the exact same people panic, assume the thesis was completely wrong, and sell near the local bottom at a loss.
They let short-term price volatility dictate long-term financial decisions. An experienced observer looks at volatility entirely differently. They view price corrections not as a reason to panic, but as a normal mechanism that clears out speculative leverage from the system. If your rationale for holding tangible, non-counterparty assets is based on long-term monetary realities, such as expanding national debt, permanent inflation, and political reluctance to stop deficit spending, then short-term price noise ceases to be a crisis.
It becomes background static. So, where does this leave us right now? If you are trying to navigate these markets without getting caught up in emotional whiplash, stop focusing on daily price ticks and start tracking the structural metrics that actually matter. Watch the pace which federal debt expands.
Watch whether real inflation, measured by the actual cost of living rather than sanitized government indices, continues to outpace wage growth. Then pay attention to how global trading partners handle their reliance on US debt instruments. The transition away from a purely unbacked fiat standard is not going to happen on a single dramatic afternoon.
It is a slow, grinding historical process that accelerates during times of economic stress. Understanding that process is the only way to keep your head clear when the headlines turn chaotic. If this kind of breakdown helps cut through the daily noise, hit subscribe and let me know in the comments whether you think the global monetary system will look the same 10 years from now.
This video is for informational and educational purposes only and does not constitute financial advice. Always do your own thorough research before making any major financial choices.



Comments 0