저자: JonMenem · 외국인
요약 보기
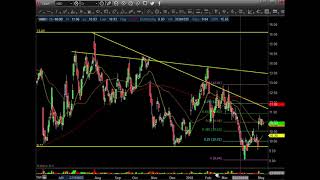
엔비디아는 실적 발표를 앞두고 있어 방향성이 50:50이며, 현재 저항선(약 250~255) 돌파 여부가 관건이라는 결론. 엔비디아: 어닝 전 상승 갭 메우기 구간(약 239~241)과 상단 추세선 돌파 시 상승 가능성을 언급. 상승 시 목표 약 250, 이중 고점 우려로 255 부근 확인 후 대응. 하락 시 200일선(약 205), 이중 바닥 203, 갭 메우기 198·190 지지 확인. AMD: 9~15달러 박스권에서 움직이며 최근 하락 추세. 12~13달러 저항 돌파 전까지는 약세 관점이며 15~16달러 부근 숏 관심 언급. 9달러 지지는 반복 테스트 후 붕괴 가능성 제기, 6~7달러까지 하락 가능성 언급. 테슬라: 277달러 지지 유지 여부가 핵심. 270 이하 이탈 시 244 또는 그 이하 하락 가능성, 307~308 및 50일선 돌파 전까지 횡보 혹은 하락 압력 지속 전망. 시장(S&P500) 약세 시 동반 하락 가능성 강조. 전반적 시장: 하루 수백 포인트 변동성이 큰 장세로, 포지션은 가볍게 가져가고 방향 확인 필요. 하락 쪽에 무게를 두며 추가 반등 시 숏 재진입 관점. 출연자 전망: 단기 조정 및 약세 우위 인식, 특히 AMD·테슬라에 대한 숏 선호. 엔비디아는 어닝 결과 전까지 중립.
다듬은 글
hello traders Jon Menem training.com / promo / stock book ii give him a call tell him stock book ii sent you alright so 11 million on the day six dollars and sixty eight cents green and 2.2 point nine five percent up on the day next day for nvidia guys you know coming off this little bit of a bullish pattern nice up move down sideways but big area will be gap fill in this top and yeah this is top right around to thirty nine forty one and then this trendline coming from these highs so if it can get above there on earnings may be a nice gap up there will be definitely writing calls on this or doing something with this as a day trade or something so i like the setup we're still inside this bar a big area if it does go up would be about 250 or so and of course double top you might as well wait for 255 or so if it does go higher if this thing goes lower then we're probably looking at the 205 on the 200ma like always guys this double bottom here right around 203 97 but ultimately you have the gap fill right at 198 91 and then another one down here at 190 328 so so right now guys if you stick this let's go let's take its put a Fibonacci level in here from this low through the last all-time high yeah so seven 500 retrace right at gap-fill as well coming from those higher pivots i just wanted to see what it was going into so yeah it came up held the six one eight boom blast off big resistance coming up guys let's see if this thing can pop through on earning so volume was pretty good on the day i got a nice green day for nvidia hats off but going into earnings to 50/50 shot it could go up or down and then of course we'll do the weekend update to look at the weekly so let's go to AMD so ambi head earnings had a nice up a little bit stalling out in this area guys not doing too much with this kind of got around the 50 ma right around the $11 even number and right where this thing's really started breaking down I want to put a I'm gonna take this fit out let's do another Fibonacci from this level I'm gonna go from this high pivot right there right here actually I'm gonna take it down to that low pivot I want to see a little bit tighter of a range here from that high to this low so the new low that the 904 level right there so ya 50% retrace so 50% up to 13 bucks 50% chance going to 9 bucks so right now not much to do down here this would have probably been the spot to go long and if it broke you know broke through that then you got a freaking get out but what a nice reverse that after that reversal that pretty much told you that you're gonna get some higher prices but then they get everybody on they shake them out one more time and then they launch it this so so right now still nothing to do I wouldn't get interested in shorting this thing maybe around 15 16 bucks and going long I can't do the nine dollar level I just can't I mean every time it bounces but there's only so many times it's gonna hit that level and then the next one it's gonna break and then break down and telling you guys from $6 $7 area when it's all said and done these markets are cranking down look look look at this like what it's doing so that's AMD guys the volume was okay today for cents down pretty much a flat day you know doing doing absolutely nothing let me put this in here though doing absolutely nothing with the you know just just a downtrend at this point so a little bit interesting we'll keep an eye on this one big area is gonna be the 12 and then the 13 you can get above there then maybe higher prices but then you come into some other resistance gap-fill stuff like that so but AMD another another just like Tesla guys just a great trading vehicle if you could get these levels I just could man when they say I thought for sure gap filled down here around 868 even gap window that's what I was kind of waiting for even this low pivot here at 8:28 and maybe but difficult if we get another shallow retrace we can't get above and above the 200 ma especially coming off this pattern guys that that's that's bullish still inside this bar kind of bearish but micro that's a small bullish pattern that could possibly pop up the 12 maybe 13 bucks maybe look at that area for a short but we'll see if it gets there I think they might try to squeeze it if the markets are doing good if the markets are weak this one will will this one will fall with the markets eventually so watch for that the volume as you can see daily chart earnings and then it dries up and we're back to normal so again I think there's your range 9 to 15 65 in the last year or so whatever so you get the shirt up there and along down there then you got a shot if it gets below it and confirms and you get out your short and it gets above that area you got to get out you know if it's a 16 or whatever you take a lighter position where you could take a little wider stock so AMD you know what can you say great trading vehicle that's off AMD all right let's do Tesla so Tesla had a nice little sell today but it held this area of support right around the 277 my members knew that area there I didn't think we'd get a huge bounce like that today but you know 16 dollars down nothing nothing scary but can't get through this area here look at this nice we wrote we shorted calls right in here we covered them and this thing went down we could have waited again got even more but we try to get 50% when we write calls guys and we get the hell out this thing went a little bit further than we had the nice pop and then boom dropped back in the earnings it's gonna trade with the markets guys if the spy is week this will wheat you know this will sell the queues are weak this will come in you know 17 million on the day is this 17 million or a hundred now 17 million on the day great volume but you know we'll see I mean this is up in sideways this isn't a bad bullish pattern and now it's holding this low I can say if you want to go long go long Tesla here you get below this low pivot you got to get out cuz it's most likely gonna be going to 244 again or possibly lower so if it can hold the 275 area 270 349 I wouldn't I wouldn't even take it that this was a spot to take it off this double bottom 76 it's um almost up ten bucks after that I mean if it gets a pullback I guess if it does this guy's and then start to go sideways these that maize curl in the price most likely lower bulls you got to get back above the mas and get above that 307 308 area you can't get above that and the 50 ma then it's gonna it's just gonna keep channel and until the market sell and then possibly more down you know downward pressure but again earnings guys let's see what it does in the next couple of days let's see how it shakes it out does it drop does it stay does it you know they they try to catch a bid in Klotz way apparently nobody likes Zeeland right now so who knows that could be a you know type of play in this but for me it's holding this support got this big green bar to my my area figures below 250 250 or so and closes we can see more selling on this thing even you know if it gets down into this area this is the bar to watch out for so holding this one how much do guys you know our head and shoulder pattern played out really well played out right to our target was this 260 we even we went 15 dollars even less right into the area where I've been telling everyone to buy for a long time so now it's up chopping around in a bullish manner hold in this area as long as it holds this 277 that's great we start getting below 270 then you better look out and we're most likely coming down in here again so test the guys right now I wouldn't touch it let it shake up you know shake itself up and down if it comes back here maybe a buy I might look a little lower you're gonna have to take the trade with the spy spy goes up this will go up spy gets wrenched on I don't care what stock it is it's all going down so market raid guys that's what I say on stock twits to market trade and then em you so I'm you not doing too much down sideways holding this trendline area this that lists little pivot here trying to hold you know trying guys I mean Brett what a great pullback again up-down retrace nice bearish pattern here down nice retrace trying to get again and then falls a little bit more bearish down here below the mas tries it again comes right back in four days sideways I've seen these banners next thing you know you start wrenching up so you know if you're shorten this that's great if you start going up towards this area you gotta tighten the stops up to get above the 50 ma then you probably had to stop out and let this thing play out I mean my shorts over with guys we already covered but if it does pop back up well shall we short this one again if it does drop I'm still looking for this area here 37 60 guys you have a gap fill here to around 44 38 42 at the 200 ma and I think we can ultimately get down to at least 40 and then the 3760 area and you know volume was it 30 million on the day 73 cents up no great shakes I mean they pushed it up a little bit today but you know great bearish pattern I love that 20 ma curling in the price 50 ma doing this let's see a chop around see if we get a little bit of a retrace then maybe the next leg down so yeah we'll look at the weekly charts come tomorrow we'll do a weekend update and I'm gonna start looking at financials and maybe stocks like ba and Caterpillar I'll do a little bit analysis on those as well there's a lot of high fliers out there guys on monthly charts these are plays that you put on and you just let them let them play out guys just like this one this one was getting stretched right here look at that but it got about heroes like alright it's almost time for this thing to pull back and boom bearish this is what does comes in sucks the people in again the Bulls and like oh here we go then they freakin flush it on them they say oh they sold in as I go chase it chasing then they dump it then you do the same thing no chase to chase it dump it chase it dump it and now this is a bearish pattern wants to see how it plays out Like and don't forget to share it whatever you want to do and so again thanks for stopping by I love making these videos trying to teach people and help people in these markets especially these markets these are crazy crazy up and down days where you could get four or five hundred points swings you know in a couple hours or so so watch for this if you have to trade go light positions that will get you through this until we get some direction in these markets you know I I leaned up more on the bearish side but I'd still like to see one more trace on all these stocks and then get another short off basically so no one day will go along here guys you know I have went long calls a couple weeks ago we did we did real well and you know I I just love shorten that's when you get the quickest move I mean like this you get this you get the great retrace on there and then BOOM 62 240 what seven gosh that's a great trade you know we wouldn't wrote it there we get our 10% and be like thank you very much and then it goes another 15% or whatever


Comments 0