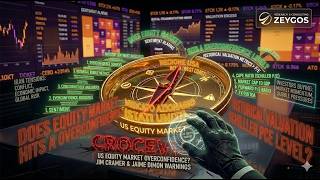
저자: JimCramer · 외국인
요약 보기
미국-이란 2주 휴전으로 나스닥 급등·유가 급락했으나 휴전은 취약하고 호르무즈 통제 문제 미해결. BofA Bull&Bear 9.4(극단 낙관), S&P500 18/20 지표상 고평가, Shiller CAPE 39.4(닷컴 버블 다음 2위). 과거 Elliott 파동상 B파 베어 트랩(1930, 2002-07) 패턴과 유사. 골드만 9월 금리인하 전망 등 기대는 비현실적이며 이스라엘-헤즈볼라 충돌도 잠재 리스크라는 비관론.
다듬은 글
So, let's imagine the scene. For weeks, we've been living with bated breath, with geopolitical tensions skyrocketing, and then, suddenly, an announcement that changes everything. The markets are exploding with optimism, a crazy rally that seems to sweep away all fear. But is all that glitters really gold?
Let's see together what the data really says behind this euphoria. Well, the reaction was nothing short of lightning-fast. Let's look at the week of April 6th. American stock indexes are making impressive gains, with the Nasdaq jumping almost 5%, and at the same time, what happens? The price of oil is collapsing, but it's really collapsing by 20% and it's as if the risk of conflict had vanished in an instant.
A real U-turn. We went from a market considered oversold, therefore super pessimistic, to well, a state of pure ecstasy. Yet, right in the midst of this general celebration, an expert voice, that of Jim Cramer, arrives to cast a shadow. He says the market is showing incredible overconfidence. In practice, he is telling us that all this euphoria may be based on foundations that are anything but solid.
And here we come to the central question. How is it possible that these two things, unbridled optimism and such great risk, can coexist? It seems like a contradiction, right? Well, that's exactly what we'll try to understand by digging a little deeper behind the numbers. Ok, let's start from the beginning, from the reason that triggered all this, the truce between the United States and Iran.
It is precisely here, in the foundations of this rally, that we are beginning to see the first worrying cracks. You see, this is not peace at all, it's a ceasefire, and a temporary and highly conditional one at that. It lasts just two weeks and everything depends on the reopening of Hormuz, which, however , remains firmly under Iranian military control.
And to make matters worse , the two sides can't even agree on what the deal means. In short, the basis of this rally is already quite unstable. And this graph, in my opinion, illustrates the central problem perfectly: total uncertainty. Just take a look at the forecasts of the big investment banks. It ranges from a rather optimistic $90 for Goldman Sachs to $120 for JP Morgan if things go badly.
There is no consensus whatsoever, just a huge difference of opinion. And what does the market do in the face of all this? Simply put, he chooses to listen to the only reassuring voice, that of Goldman Sachs, and pretends that the other scenarios, the riskier ones, do not exist. This is a textbook symptom of overconfidence, a selective listening, where bad news is simply swept under the rug.
Okay, now let's step away from geopolitics for a moment and look at the hard data. Let's try to gauge the market's fever, so to speak, because several indicators are flashing red. Here it is, 9.4. This is the value of Bank of America's Bull and Bear Indicator. What does it mean? A level of 9.4 out of 10 means extreme optimism.
And here lies the paradox. Historically, when optimism hits these levels, it 's often a signal to sell, not buy. It is a contrarian signal that warns us that the market may be nearing a peak. Not only that, according to the same bank, the S&P 500 index is statistically expensive based on 18 out of 20 metrics.
In practice, almost every way we have to measure it tells us the same thing: prices are high, perhaps too high. For example, the ratio between the value of the entire market and the country's economy is very close to historical highs. And then there's this number, the spread on high-yield bonds, which, simply put , is the extra premium investors ask for lending money to slightly riskier companies.
When this number is so low, like now, it means that there is an incredible calm. Investors don't feel the need to be paid for the risk they're taking, a clear sign of complacency. And now we come to one of the most important metrics for long-term valuation, the Shiller P/E ratio , also known as the CAPE ratio.
Its value today is 39.4. To understand what this number means, just look at this graph. The current level is the second highest in the entire history of American markets. That ’s lower only than the absurd peak of the dot-com bubble in 2000 and even higher than the levels seen before the great crash of 1929.
Makes you think, doesn’t it? Now, let's leave today's data aside for a moment and look at history, because perhaps we've seen this kind of rally, a little too good to be true, before. And it did n't end well. In technical analysis there is a very interesting concept, the bull trap. According to Elliott Wave Theory, wave B is a false rally.
It's that rise that makes everyone believe that the worst is over, that the crisis is over, but in reality it's just a pause before an even deeper fall. And the sobering thing is that the recent movement of the S&P 500 seems to follow this script to perfection. It recovered 76% of its previous losses, which is a textbook characteristic of this type of deceptive scheme.
History, on the other hand, is full of these examples. In 1930, after the great crash of '29, there was a very strong rebound that gave everyone hope before the total disaster. And let's also think about the period from 2002 to 2007, a 5-year rally that recovered all the losses of the internet bubble, only to set the stage for the financial crisis of 2008.
Okay, now it's time to put all the pieces of the puzzle together. We have a fragile truce, alarming market data, and historical patterns warning us. The picture that emerges is coherent, but also rather worrying. This overconfidence is creating expectations that are frankly unrealistic. The market is hoping that low oil prices will solve the inflation problem by themselves and that this will prompt the Federal Reserve to cut rates immediately.
But what is the reality? That logistics and transportation costs are still high and that even the most optimistic analysts, such as Goldman Sachs, have already moved their forecasts for a rate cut to September. And there's one last thing, an elephant in the room that the market does n't seem to want to see.
While everyone is celebrating the truce between the US and Iran, hostilities between Israel and Hezbollah on the border with Lebanon have never stopped. And this is a huge geopolitical risk that could blow everything up at any moment. So, to summarize, the bottom line is this: market overconfidence rests on four very, very fragile pillars.
First, believing that a two-week truce is a permanent peace. Second, ignore the huge and unresolved problem of who controls Hormuz. Third, downplay valuations that are among the highest in history. And fourth, perhaps most dangerous, mistaking a potential bull trap for the start of a major new bull market.
All of this analysis suggests a very different strategic approach to navigating this uncertainty. Instead of blind euphoria, perhaps a healthy skepticism is needed. As the saying goes, assume the worst-case scenario while still hoping for the best. And that leaves us with one final question, a provocative question.
The market, right now, has bet everything on a perfect outcome, a scenario where everything goes right. But in such a complex and uncertain world, one wonders what the true price will be if this gamble turns out to be wrong?


Comments 0