
저자: Kim's · 한국인
요약 보기
미국 증시는 N자형 상승 파동 속 상승 추세로 판단, 다우 38,000 유지 및 20일선 돌파 시 추가 상승 전망. 테슬라는 120일선 돌파 후 상승 지속, Apple·S&P500·MSFT 상승 여력 언급. 반도체 ETF(SOXL, SOXX) 상승 추세 유지, 중기 보유 권유. 비트코인 관련 코인주(CleanSpark, Marathon)는 상승 여력, Coinbase·MicroStrategy는 단기 조정 후 상승 전망.
다듬은 글
Rather than worrying in advance and acting, we just have to respond according to the situation at the time. Good news and bad news always coexist. That's why you need to have your own investment standards. Yes, hello, Tuesday, June 18, 2024 Kim's USA Let's start the stock market. This is before the market starts on Tuesday, June 18th in the US market.
If you click like once before watching the video, my upload time will be a little faster. There are people who watch without clicking like, but if you click once, you can watch the video faster. There will be. Now , "Investment is simple is best" in the comments today. There are some who think investing is too difficult, but I will do all the analysis, so all you have to do is eat.
Please watch the video carefully and enjoy the community. Please take a look, and it will be a great help in investing. If you see that the number of subscribers exceeds 50,000 in 4 months and the number of regular viewers exceeds 20,000 every day, there must be a reason. Now, let's take a look at how the US stock market did yester.
It showed a rise of about 1% yesterday, showing a very strong performance. What was the title of yesterday's video? One of the thumbnails was that a crisis is an opportunity. Instead of worrying in advance and acting, we just have to respond appropriately to the situation at the time. People who think investing is too difficult are scared in advance by news headlines and do not invest.
Good news and bad news always coexist. Even great experts say things will rise further. From now on, opinions that things will fall will coexist. That's why you need to have your own investment standards. My standard is not to be afraid of the market in advance, and as always, This correction is short, and the bull market is long, so when a down signal appears, you react only then.
At this time, there was a lot of very bad news. But what about the market? An N-shaped rising wave that reaches the lower line of the upward trend and eventually reaches the upper line. Moreover, the N-shaped rising wave is a strong N-shaped rising wave. In conclusion, you can say that the U.S. stock market is still in an upward trend.
Now, let's take a look at the Dow Index. I also mentioned that I must maintain the 38,000 points for the Dow Index. I gave it to you. It still maintains 38,000 points, and now the 20-day yellow line is coming down slightly, and even if the Dow index rises only a little, it breaks the 20-day yellow line and goes up.
If this happens, it will go up again along the upward trend. Now, let's look at each stock one by one. Let's go. Let's take a look at Tesla first. Now, as Tesla approved the autonomous driving FSD test in China, it showed an increase of about 5.3% yesterday. Those of you who watched the Part 2 video of Tesla will know that it meets resistance once and slightly at the 120-day brown line.
I put pressure on it, and short-term indicators, medium-term indicators, and long-term indicators are all in an upward trend. I told them that if the brown line crosses the 120-day line, there will be an additional increase. In the end, the N-shaped upward wave that I have been talking about for two months ago has begun.
I'm watching. I'm sure everyone was tired of the $167 I've been talking about. It hit $167 just twice, creating a double bottom pattern, and finally broke through the 120-day brown line. It's currently rising after breaking through the 120-day brown line, and it 's rising until today's market close.
It is best to show that it is doing so. I explained it in detail yesterday with the weekly candles. It closed lower on Friday last week, but in the end, it ended with a weekly candle . He mentioned that if it ends with a weekly candle, there is a high possibility of an increase next week. I told you this.
I am seeing that this week's weekly candlestick situation is very good. Right now, short-term indicators, medium-term indicators, and long- term indicators are all trending upward. In the daily candlestick, the short-term, medium-term, and long-term are all trending upward. In the weekly candlestick, the short-term, medium-term, and long-term are all trending upward.
I think Tesla's situation is good right now. If you look at Tesla , I mentioned on June 13th that you should collect Teslas in the community's rankings , and the next day on the 14th, I also mentioned that you should collect Teslas. Now, as I write down the rankings like this, I will diversify my investments little by little.
If you proceed with the purchase, you will get good results. Many people, even if you don't watch the video every day , are earning a large enough profit just by looking at this community's ranking and trading . I mentioned that you should collect again before Tesla breaks through the 120-day brown line like this.
Next, look at Apple. As you can see in Apple's video yesterday, I mentioned that it will rebound while supporting the 5-day pink line. Apple can reduce its proportion by about 10% to 20% when the 5-day pink line is broken . Yesterday, it showed a large increase of up to 3%, but then rose by 2%. It closed at .
The stock, which is already number one in market capitalization, has been taking returns of about 30% for a month and a half. When looking at Apple as the main figure, it is going up in this N-shaped upward wave . Now, this wave can easily continue to $225. Moreover , since the golden cross has just come out in the long-term weekly weekly indicator, it can be seen as very good in the mid- to long-term, and Apple does not have any selling ranges above.
Since it has broken this double candle and risen, $200 will become another support line. In conclusion, Apple is running very well, and the price range of the 5-day pink line is $212 as of now. Now, the price line I'm talking about changes every day. These flat lines move, so please come and check the video.
Next, let's look at the S&P500 . As of June 12th, we are continuing to inform you that the purchase rate is 2nd. We are riding this upward trend and have informed you of the purchase rate at this bottom line, but since there is still a lot of increase to the top line, this is an N-shaped upward wave.
Even while it was going up, I continued to inform the buying point through the community. I strongly avoid investing a lot of weight near these high points. You always have to collect a lot at the bottom line, and I am making sure to collect at the inflection point of this N-shaped upward wave. In conclusion , the S&P 500 still has a lot of room to rise up to the top line, and is showing a very strong performance without breaking the 5-day pink line.
Next, let's look at Microsoft. Microsoft is also one of the stocks that was highly emphasized. TSMC, Microsoft I said it a lot. It is rising with this rising trend, and in the AI era, Microsoft, TSMC, and Nvidia were among the stocks that should never be missed. At this bottom line, it is currently rising by creating a double bottom pattern, and as you saw earlier, Micro took first place on June 12th.
Soft Microsoft on June 7th Microsoft on June 6th I collected a lot. Now, when looking at the entire period of Microsoft, it is showing a rally in the new price without any listings above. In the end, I mentioned that the previous high point will be surpassed. I did it for you. Even if you look at the top line of the upward trend, there is still room for rise even if you look at it in the short term, and even if you look at it for a long time, there is room for rise.
Instead of reducing the proportion in advance, when a down signal comes out, when an adjustment signal comes out, slightly reduce the proportion and again in the bottom section. You just have to grab it when you have the chance. Next, let's look at Super Micro Computer. Super Micro Computer showed a large increase of about 9% yesterday.
It is showing an additional increase of about 1% even outside of the current hours, and Super Micro Computer also showed an increase of about 1% on the day of June 10th. Super Micro Computer also showed an N-shaped upward wave on June 11th and mentioned that there was a good possibility of the price rising to $870 on the 60-day green line .
It was immediately rising in an N-shaped upward wave, and the 60-day green line was $870. It is showing a trend that exceeds the limit. So I raised the target price once more. The target price is now the previous high point. It will run toward $950. Super Micro Computer also showed a rise of about 9% yesterday, and yesterday through the community, we I collected it again.
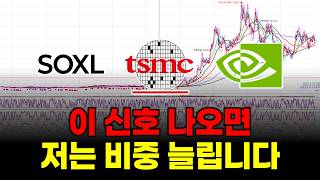
Now, let's look at soxl next. Soxl showed a large rise of about 5% yesterday and is currently showing an additional rise of about 2% even after hours. It is showing a very strong performance and is going up in an upward wave. I gave it to you. Now, if it breaks through the previous high point, there will be another strong rise.
As of now, the 5-day pink line is rising well, so we can continue to hold it without reducing the proportion. Now , while it is rising like this, we also informed you of the purchase point yesterday and in June. On the 13th, I also told you about the buying point for SOXL TQQQ. Because now, rather than the peak, it is in the middle of an N-shaped upward wave.
Of course, it was best to collect at the inflection point. I told you a lot about the buying point at the inflection point , but for those who don't have it, this strong N. This is a position that can be entered even when the upward width still exists due to a rising wave. In this case, you should not miss it.
Let's look at the big picture with SOXL as SOXX. It is going up on SOXX with this upward trend, and the width to the upper line still exists. You can see it. Just like SOXL, I believe it will follow this upward trend and eventually reach the top line. It is showing movement within a strong upward trend.
So, don't be scared by getting ahead of yourself too much. It is currently an upward trend, so look at the chart objectively. While looking at the market situation, you should reduce the proportion at that time when there is a signal of decline, and you should not reduce the proportion too much in advance.
And even if you reduce the proportion, it is still in an upward trend, so continue to hold a 50% proportion, but keep it at 10% within the 50% range. 20% At that time, when it reaches the top like this or when there is slight resistance near the previous high point, in this case, you take profits slightly and switch to stocks at the bottom.
The same goes for Palantir Tech. Now, sell the stocks that made profits like this. We moved a lot to stocks that were at the bottom of the Tier Tech test . Palantir Tech showed a very large rise of about 6.5% yesterday, eventually creating a long-term indicator double bottom pattern and rising in a strong upward trend.
The previous high was $27.5. It shows a double bottom pattern that rises to the bottom. Good stocks should be collected when they are at the bottom. I hope you don't miss the video and collect the stocks that I say are good. Now, it is going up on this upward trend, and the upward trend is up to the upper line of the trend.
There is still a lot of width left. Now, let's look at Clean Spark. Now let's look at four coin stocks. Now, Clean Spark showed a very large rise of about 9.5% yesterday. We Class Park are also loading on June 14th. Clean before trading. I also collected Spark, and I collected it from this bottom section.
The first target price is currently looking at $20, and now there is about $2 left. It is given by the long-term indicator upward trend, and there may be some resistance around $20, but in the end, it is. I think it's going to be near the peak. Next, let's look at Coinbase Global. If you look at Coinbase Global , unlike Clean Spark, the short-term indicators are trending downward and the medium-term indicators are also currently trending downward.
Ultimately, the target is $283. However , since the short- to medium-term trend has slightly turned downward, it seems inevitable that a slight adjustment will be made and then go. So, when Coinbase Global also adjusted, those who were in the bottom section would reduce their weight by about 10% or 20%.
While doing so , I helped you re-capture the stocks that were at the bottom of those that realized profits. With this N-shaped rising wave, in a larger sense, they are going up. Now, let's look at the micro strategy. The micro strategy is the same as Coinbase Global. Currently, the short-term indicators are falling.
The medium-term indicator is falling in a downward trend, but is now receiving resistance near the previous high point. Since this selling range is showing a slightly strong appearance, you can see it as going up with a slight adjustment while going up in an N-shaped upward wave. Now, next is Marathon Digital Holdings.
Let's take a look. Among the current coin stocks, Marathon Digital Holdings and CleanSpark seem to be better positioned than other stocks. They are riding this upward trend and are showing efforts to continue supporting near the bottom line of the current upward trend. In the end, Marathon Digital Holdings It is expected that the price will first reach around $22.50, the previous high point, and secondarily reach $25.
The period is expected to be approximately one month. Next, let's look at Intel. Yesterday, Citi issued a report in May. A report came out that said laptop shipments could benefit Intel and AMD as laptop shipments increase, and showed an increase of about 1.7% yesterday. This is a time when Intel needs good news one by one.
The bottom is well under way now, but since no good news is coming out, it is difficult to break through this bottom. If large-scale good news comes out once in a while, it can immediately hit the top. This is a section. Next, let's look at Eli Lilly. Eli Lilly is in an upward trend when viewed broadly as an N-shaped rising wave, and is currently riding the 5-day pink line well.
When the 5-day pink line breaks, you can reduce the proportion by about 10%. In conclusion. So, from this point on , you have to keep making profits without realizing it even once. Eli Lilly also provided a buying point even before it broke through the high point before the 60-day green line, and through the community, Eli Lilly again took second place on May 24th.
Even in the midst of the rise, I was able to give it because it was going up strongly due to the rising wave . Trading should always be easy. Now that the previous high point has been broken through the continuous resistance line, it has shown a big rise. It is the same even now. It is the same as it is now.
There has been an increase. Now, if you look at Broadcom, this is the same. If you look at Broadcom, it shows a big rise once as it breaks through the continuous resistance line, but then again, it shows a huge rise again as it breaks through the resistance line . Compare all the stocks like this. You have to invest while analyzing it as you go .
However, it is impossible for people who are busy and working to analyze all the stocks. That is why I will analyze them for you, and you can invest cash one week at a time based on what I analyzed. You can invest by saving money every time you have it. Now, Novono Disk, like Eli Lilly, eventually broke through the previous high point in an N-shaped upward wave, and is now showing a trend of breaking through trending downward.
Therefore, I am mentioning that it may be slightly depressed and then go to the 20th line. Next, let's look at Corning. Corning is showing a very strong performance. We set a buy point at the bottom line, and in the larger view, this downward trend is over and it is supporting and rebounding. When doing so, the black line and the 1000-day line are very strong resistance and support lines.
I shared the purchase point just before it breaks through. It has been showing a continuous rise for about a month now and is showing a profit of about 17%. Always look at the big picture. You need to hold on to it and proceed with your investment. That's how you can trade comfortably and sleep comfortably.
In the second part of the membership video that follows, we look at all the stocks below and ask questions about NVIDIA, Alphabet, Amazon.com, Meta, TQQQ, Qualcomm, AMD, and TSMC. We will look at all stocks such as Broadcom, ASML, Lululemon, etc. Well, I hope everyone has a good day today and a successful investing day. .




Comments 0