저자: 미상 · 외국인
요약 보기
엔비디아(NVDA)가 236달러 고점에서 200달러 부근까지 조정 후 반등 중. 진행자는 M/W 등 차트 패턴과 측정 이동(measured move) 기법을 설명하며, 현재 200일선 지지 여부가 핵심이라 보고 200 하회 시 180 부근을 주시한다고 함. 현 시점은 중립이며, 당일 종가가 200일선 아래면 하락 편향이 강해진다고 언급. 방송은 기술적 분석 교육 목적이며 Patreon 회원 그룹 홍보를 포함. 지지·저항과 예측 발언은 단기 차트 관점에 한정.
다듬은 글
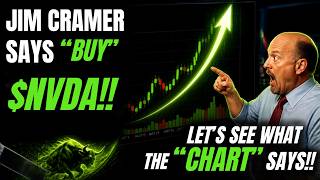
Here we go, guys. Welcome back to the channel. Welcome back to a new video. Let's jump right in. Just in Jim Kramer says, "Buy Nvidia stock." Okay, so we're going to break down the chart. Let's see what the chart says and go from there. And the main purpose of this uh video is to kind of show you guys g give a little peek into our uh Patreon members group and uh how we teach our traders how to read the chart so that if you see an influencer out there that you're following you know it doesn't matter if it's Jim Kramer that's just happens to be who you know said this this morning I could be someone on X a YouTube person whatever and if they say hey you know buy XYZ or buy, you know, ABC company or or crypto, altcoin, Bitcoin or whatever.
You can go to the chart and double check and and see for yourself. Okay, as simple as that. But let's jump right in. As you can see, Nvidia's had a pretty good little pullback here uh from the highs around 236 down into the 200. And and speaking of that, I'll go ahead and give you a little secret. I'm not going to, you know, uh, I'm just going to hit the high spots.
Give you a little secret here, a tip that we teach our traders. And the bigger the gap between the 200 and and the high price, okay, as you can see, I didn't go over here or over here. I went, you know, from where it started out to the top and then looked at how big the gap is. Okay, the bigger the gap, the higher the odds, higher probability that when it comes down, you're going to get a bounce.
Okay, and if you had gotten into this, if you had known that trade, there's people that make a living full time just doing that setup. But anyway, that was about a 4% Yeah, about a 4% move. Little, you know, a little almost five really uh off the 200 there. Just, you know, kind of give you an example.
But anyway, let's jump right in and how markets reverse. And I say markets, it can be again uh crypto, uh, Bitcoin, your altcoins, gold, silver, uh, but any AI stock, tech stock, as you can see here, they all do the same. Okay, it's either a at the top it's a reverse V-shaped, you know, crash or it's an M formation.
Now, there's other variations of these where these are the two main ones as you can see here. We put in that M formation. Okay? And you know, here we are. Now, what the bulls want is either a V-shaped recovery. Everyone's heard of that, you know, similar to this. Okay. And and then uh a W formation.
Okay. Low, higher, low, which here low, higher, low. So, we'll see if we can go. Okay. Low, higher, low, go. All right. But, uh, anyway, there's some other nuances, but that's that's the main deal. The 200's uh real nice right here having it as support. But what we have to look at now is this uh you know the uh uh expected moves.
Okay. So we have this downside uh here and then the bounce. Okay about 11%. So, how you do that is that after the bounce, you take your measuring tool, put it over here, and that gives you and as you start coming down an estimated, nothing's 100%, but it gives you an estimated location of where uh price is going to drop to.
Okay, a measure, it's called a measured move here. Okay, and as you can see, it's right here. We exceeded it. See the there was the measure move but it even came down and exceeded. Now sometimes you exceed it which you know you're happy for. Okay, a little extra money and sometimes you know it doesn't doesn't like if it was here you know it doesn't make it but you know we got a solution for that too.
And then currently okay this next measured move goes from there to here and then what do we do? Bounce. So you take it, put it over here, and it kind of lines up almost perfectly with this support here. This uh gap support. Now, see, see the gap here, it gapped up over our 200, the 200 then be instead of resistance, it became support again.
See the support off the 200 got under it, got over it, held, and then you know, the rest is history. But anyway, uh that's the measured move here. If if if we fail and come under the the 200, that's when I would be looking, you know, at that 180 or or so. Okay. But right now, what price needs to do, you know, not financial, just my humble opinion, is get over Oh, come on.
this previous support here which is as we come up as you can see is resistance resistance we already tried it again came down hit our heads couldn't get through couldn't get through uh so we'll be that's really what you need to be watching right there and then and I put this on just to kind of show you how uh in real you know real time like you know right this second as we're videoing how much affect these previous support zones.
So even though it's red, it's support. It didn't go through there and close under it. It bounced support here, resistance over here. How important that is uh on the chart. Okay. U now I'm going to put this since we got a little bit since it's a green candle and we got a little bit of a bounce so far.
Knock on wood today. Okay, let me put that in so you can see it. A low through here. Came up, came down. Something like that. That W. We will see if we can get up and out of here. But tomorrow, the next day, obviously, uh we close under there. then you know the bias is more on the bare side as far as come back retesting the 200 or maybe even going lower if we break the 200.
Oh my goodness. No telling where this well 180 we already kind of know that but uh in the meantime see that 20 is in its power. I'm going telling you more and I probably shouldn't be here but anyway is in its power move to the downside. Let me make that blue for the 20. And see, we got under it, over it, and then if we once we got back under it again, it became a 20 halt.
Okay, a 20 halt. It halted price. Okay, what we want to do is figuratively speaking and come down get over it even come back and then as it's curling up come back retested and and bounce. Okay, to give us more like right here, see we were under it over here. See the blue under it. Let me do this so you can see it better.
You were under the 20 over the 20. Come back in. Yeah, we we closed under it right here. But the next day the 20 it got back price got got back over the 20 and stuck the 20, held the 20 like Olympic gymnast and then you know you're off to the races. Okay. So that's that little uh hour move that you want to you want to see.
So uh right now we're neutral. We're not you know bullish or bearish. the bulls of bears kind of fighting it out cuz we're basically in this little, you know, oh come on in this little, you know, consolidation zone here and then we're just going to sit on our hands. Okay, 90% of this is mental to be honest with you.
uh and and then just knowing a few setups, you know, uh uh you know, the W formation, M formation, uh you know, off you know, a particular move. Anyway, um not to drone on drone on about all that, but anyway, um get, you know, two or three of those under your belt because, you know, if you have to think about it, you're, you know, if you got to squint your eyes, look at it, and you don't really see the move or the breakout or the breakdown, then you shouldn't get in in it.
Okay? You got to know it. Okay? thinking equals losing. Okay, it's counterintuitive. Knowing equals winning, you know, at a high percentage, okay, because you can still the, you know, once you click the mouse, news can come out, whatever, and it can still, you know, even if you're, you know, breaking out, you know, like this here, something can happen and you, you know, uh you lost your uh momentum there to the upside.
So, uh, you know, that's kind of what I want to point out. It's it's not your fault. It's just, you know, if you get a good location, a good event candle, put your stop loss in, uh, anything can happen. But, all right, guys. Uh, man, I could talk about this stuff all day long long. Love it. Okay, but thanks for watching. Check out our uh Patreon members group and we will see you on the charts.
Comments 0