저자: 미상 · 외국인
요약 보기
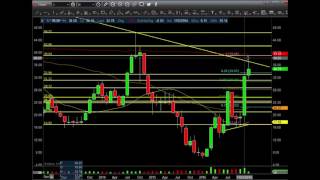
결론: 영상은 엔비디아(NVDA)와 아마존(AMZN)을 중심으로 단기 조정 가능성을 언급하며, 시장 방향에 따라 함께 움직이는 장세를 전제로 한다. 엔비디아(NVDA): 일봉에서 250 리트레이스 지지를 유지 중이며, 추세선을 깨면 84~85 피벗 하향, 단기적으로 78, 나아가 67·55달러(50일선 부근)까지 하락 가능성을 언급했다. 시장이 랠리하면 100달러 부근까지 열려 있다고 봤다. 월봉은 이동평균선에서 크게 벌어져 있어 되돌림이 올 수 있다고 봤지만 시간이 걸린다고 했다. 엔비디아 옵션 전략: 풋은 어렵고 콜 매도가 낫다는 견해를 밝혔으며, 1~2개월 만기 외가격 콜 매도를 제시했다. X(US스틸): 17달러에서 약 40달러까지 급등해 이익 실현이 필요하다고 봤다. 31달러 갭 메우기 가능성을 언급하며 절반 매도 후 추가 수익을 노리는 관점이고, 28~73 부근 갭 메움 가능성도 언급했다. 아마존(AMZN): 주봉상 약세 패턴이 형성 중이며 20주선 아래에 있어 연말 하락을 예상했다. 다만 778~790 부근 20일선을 돌파하면 신고가(880 부근)를 시도할 수 있다고 봤다. 단기 하락 시 709~710 부근이 목표로 언급됐다. 실적 발표를 앞두고 50대50 확률로 보았다. 시장 전망: 스파이(SPY)와 IWM 거래량이 늘어나면 고점 매수세를 경계해야 한다고 언급했으며, 지수가 하락하면 개별 종목도 함께 하락할 가능성이 크다고 봤다. 리스크: 단기 포지션 위주이며, 과도한 급등 후 되돌림 위험과 실적 발표 변수가 있다. 진행자는 특정 조건을 중심으로 관망과 분할 대응을 강조했다. 출연자 전망: 진행자는 단기 조정 가능성을 우세하게 보지만 장기 방향은 명확히 제시하지 않았다.
다듬은 글
Nvidia and US steel the symbol is X on that one we follow let's get right to Nvidia let's go to the Daily and right now it's holding up okay we're back into this trend line we're holding the 250 retrace and let's see if we could crack the trend line or do we go right back up to double top and maybe maybe just maybe shoot for the $100 area if the markets do rally in the next couple days to 20,000 stocks can be euphoric they might all start moving up so be aware of that so if you starting you know to add short this one or if you are short this one just stick around for this and I'll show you why in a second on the monthly time frame but right now holding up okay if it does start to move down next next level believe this little pivot down in here around 84 85 but uh shortterm maybe 78 60 but you know we got to break this pivot first and we got to see what pattern or you know it could just fall into it tomorrow and uh the next day I don't know so just keep an eye on this one keep an eye on volume see if it starts picking up on the bigger volume days that's when you get a little more selling but you get a nice uh pushup on volume with the spy and the iwm and they get some volume coming in maybe some more uh hedge funds or money managers buying up the you know buying up everything at the highs it's just kind of crazy I don't know I'd wait for a pullback if if that was me but that's me uh weekly chart for NVIDIA again not nothing nothing terrible you have a little tail here little inside bar pattern setting up on top of this uh trend line so let's see if we can hold the 250 retrace if it does really start to come down the Market's come in I mean this thing can be h73 maybe even 67 possibly even you know to this 50 ma wherever that might be around maybe 55 bucks or something so just beware and the other reason why the monthly chart is stretched so as as far as you're away from all these moving averages and it keeps moving up eventually it's got to come back towards them and it's just a matter of picking these things off but on a monthly chart this will take time this will take a couple months coming in so you got to be patient with these trades puts are tough calls calls don't writing calls it works on these two you you'd have to write it up right when you know right when it moved up the couple times daily chart I mean you could have wrote a call right here you know double top right you know four days up you got a probably decent premium write them a month or two out maybe in the money maybe a little bit out of the money but uh yeah the they should come in this should come in pretty nice and next month or so in in my opinion guys you know filing the sharts but again it it's okay we are below the 20 ma you know you got to keep an eye on that too uh let's look at x x same thing you know this just had a heck of a move and and moves like this you know a uh retrace is coming up so you got to be really careful with these if you get a run up from 17 to almost 40 you got to take some profits I mean you know and that's the bottom line guys this thing hits some trend line here hits uh the 30 39 even number going for the 40 never made it there because every all the technical guys are waiting at the 40 where I'm just slowly adding this this thing goes up and then you miss the trade and you get a nice pullback right now we're in the money on the trade already we got a three-day pullback and maybe we'll get two three more days come down into the uh Gap fill down 31 bucks or so and we'll sell half and maybe try to get another Buck or two I'm still thinking we can fill this Gap and maybe fill this Gap around 2873 if the market stay buoyant you know do we get a shallow pullback and we go up right now there's really no pattern other than a couple days down which shows a little bit weak but we came in a good resistance expect the pull back do we go all the way back into this area or do we stop here and start moving up again that's what we have to wait for weekly chart showing pretty much the same thing you know we had a little tail up here a little reversal let's see where we Clos on a weekly basis I mean if we close down in here around 30 bucks then man I'd expect the lower prices but again it's only uh you know it's early in the week let's see what the uh rest of the week brings monthly chart monthly chart though a little bit stretched and this was the other big thing too you're almost in a double top you're into this trend line 200 ma even number 40 you got to start take if you're not short this thing you know up in this are we started adding we're um about a buck in the money right now so we're doing pretty good and uh yeah we're going to see if we can get another couple bucks and we'll be out we will be done with X and that's what we do just short-term positions boom boom take the runny and run you know good trading areas you get you might get a $10 pullback in this one who knows too far too fast that's it kind of like this look at this up sideways bar bullish pattern here pops up couple months and then boom just Slaughters everyone boom boom pops up right the great resistance what do you think's going to happen so you got to be pretty careful with these guys so and then uh what else can we look at let's take a look at Amazon Amazon's just kind of uh what was it down today $854 I was watching this one on a 10-minute nothing too exciting but you know nice retrace back up comes back 750 retrace comes back up kind of holds into this area gets above the 20 ma so technical or technicians it's slightly bullish but now we're closed on top of the ma so let's see if it uh slowly starts bleeding you know we came in bounced up came down kind of just just another shallow retray it's getting worse and worse now it's shallow does it roll over and come right into the 200 we have good support down in here guys don't get me wrong so even if it goes down maybe 40 bucks you know if it really if the markets are going then you know you're probably looking at the 7 709 710 area so on Amazon but right now not bad you are below the 50 and kissing the 20 so it's kind of a 5050 shot when it goes up or down but after runs like this guys I I think everything's still going to pull back a little bit you know and this is the other reason too on the weekly we have a bearish pattern setting up we're below the 20 ma we've been one two three four five almost six week sideways here you know we get another week or two or three or four more weeks of this same action we're probably going to head down but if that pattern fails we probably attack the all-time highs maybe even go to 880 you know for all your Longs the Longs you get back up in here you're looking at the Double top you got to get through double top first and then confirm but man as long as we're under these first step is above the uh 20 ma here let me zoom in 20 ma you know right in this area here right around the seven yeah 77902 right there so we got to get above that we aren't so as long as it's doing this consolidation if it goes another couple weeks and I'm expecting lower prices come the new year on Amazon but that's me uh earnings would come up so that's that's a 50-50 shot so but that that's not for a little while I'd expect this thing to pull back a little bit more if the markets do you're going to see a little bit more of a pullback if the markets stay buoyant you get may maybe down to 709 700 but again it's not it's it's it's doing okay everything's kind of a market trade guys if the spy and everything goes down all these things will go down if the spy and everything keeps moving up like the Dow or the q's then everything should start pushing up so so it's really that's why I call it a market trade and we go from there so all right well that's um a couple stocks I want to take a look at and share with uh share my thoughts with using technical analysis but uh again guys thanks for watching my videos come join me on uh YouTube on my live uh streams during intraday action we we'll possibly do one tomorrow so uh just heads up there if you get an email or stuff coming by bring a symbol we'll take a look at them and try to figure out which way these stocks will go guys all right uh thanks again for coming to uh watch my video and I really appreciate it guys and God bless and we'll see you on the charts


Comments 0