저자: StockBookie · 외국인
요약 보기
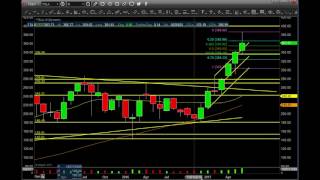
2017년 6월 30일 기준, 진행자는 엔비디아·AMD·테슬라 차트 분석을 제시하며 전반적으로 단기 조정 가능성에 무게를 둔다. 엔비디아: 일봉은 50일선·200일선 위에 있으나 상단에서 약세 신호가 나타났고, 1,330~1,200달러 구간이 1차 지지로 거론된다. 주봉은 장기 상승 구조 유지 속에서 1,685~1,750달러 신고가 부근의 저항을 확인해야 한다고 본다. 목표 시나리오는 175~180달러 구간이 언급됨(원문 수치 불명확). AMD: 일봉에서 20일선 이탈과 반복된 헤드페이크로 약세 흐름. 주봉에서 반전 시 하락 가능성을 제기하며 75~70달러 부근 하락 시나리오를 언급. 상방 레벨로 17.77·20.65·23.25달러가 제시됨. 테슬라: 일봉은 200일선 위지만 20일선 아래로 단기 약세. 400달러 돌파 시 425~450달러 상승을 언급하고, 주봉 약세가 확인되면 하락 가능성도 열어 둠. 하단 지지는 337·324달러, 20일선 306달러 부근으로 제시. 7월 실적 시즌을 변동성 요인으로 언급. 전반적으로 세 종목 모두 방향성이 명확하지 않은 '50:50' 국면으로 평가하며, 시장 강도에 따라 등락이 갈릴 수 있다고 설명한다. 리스크: 주요 이평선 이탈 여부와 실적 시즌이 핵심 변수로 제시됨.
다듬은 글
guys we'll go to the daily chart on Nvidia 18 million on a day a little bit light uh a little bit up after hours but down $212 so um not not the best showing today but not the worst we're trying to hold this upper area here and these lower pivots at 14210 which we are this was a little bit weaker close but let's see if we can pop up on Monday probably light volume the day before 4th of July and maybe get back above here and start making a run for the 750 than the all-time high so it stays down in this area then we're most likely going to set up to go little more downside here 50 ma will be the first support with The Gap fill right around you know 13306 and then you got the another area around 120 Gap window then Gap fill right around 103 104 area so right now though guys nothing wrong still above the 50 and the 200 Ma in a strong stance but slightly bearish up here at the top here with this inside bar red candle let's go to the weekly weekly same thing but he had a little tales on the weekly telling us this this thing wants a little more downside I still think we get a little higher maybe it's got to come up to the 16850 the all-time high and then crack through this is still bullish still above the 20 the 50 and the 200 Ma on the weekly but a little stretched 120 I think my target is right now but let's see what happens but great little tail here came right in follow through we closed on top of this topping tail let's see if we get some follow through next week that will be very important first step if you're bearish if you're bullish you want this thing to click over and go straight up shoot for the 750 retrace all-time high then like I said you're looking at 175 to 180 area on Nvidia monthly chart though guys nice tail candle on here um let's see if we get a retrace and then maybe more downside the only way this uh tail is going to fail if we close above the 16876 area or 16850 area so let's see what happens uh next month see if we grind up higher or do we actually start uh possibly moving down a little bit more monthly yeah this this is a little this is interesting guys Nvidia so we had a pretty good uh volume on the month and uh let's see what July brings us on this one AMD AMD another little week course today let's go to the Daily gosh guys perfect you couldn't ask for a better pullback off a uh Gap fill little double top here right to it came right back in right to the 20 ma now it closed below that could be a little head fake so watch out maybe we get a little bounce next week still have a gap fill Gap fill going on the way up so let's watch for that if not you have some gaps to filled on the way down and then the 200 ma down here you're back in this channel again guys another head fake right back down head fake right back down head fake right back down a lot of times this will want to do this four or five times this will be the fourth head fake right here sometimes that will want lower prices to come that area cracks 200 ma next support next area would be double bottom around $10 so gosh another great another great uh short here guys I'm not trading this one right now I'm in a lot of other other positions but this is been a great trading stock so if you've been listening to my videos you knew this was great uh resistance areas you could have taken this one short for a couple days so hope you did all right let's go into the weekly weekly chart same thing what do we talk about talk about this big red bar that had closed above that I was like wow this thing's pretty bullish this thing looks like it wants to go great volume case scenarios it grinds up gets through the double top and goes to the uh 1625 area 1622 area worst case scenario comes right back down closes below the 20 ma ugly close this a wasn't a full engulfing candle but um at least uh 60% probably 65% and we get more follow through on Monday which the Market's going to be asleep I might not even be here guys so we're going to see about that but comes right back down you got the trend line stuff like that but uh if we get follow through on the weekly guys I think we're heading for lower prices on AMD I I've been saying 847 943 I still have an area gosh I'm going to say 750 to seven bucks if if if this pattern plays out this thing starts coming in I mean you can even go right to the 200 Ma I know you guys don't want to hear it but that that's just the way way it is but upside I have 1777 and then 2065 and then we'll take it from there and those are high pivots and possibly a gap fill up in here a gap window so watch out for that but right now with this reversal guys let's let you better hope Bulls it needs to reverse right back up and continue going if you get followed through to the downside on the weekly you will have lower prices to come I have 388 that that might have been from a while ago though but yeah you have pivots up in here and then you have areas up this you know I got 23 bucks too guys either way but you know when you start getting a red candle like that inside bar weekly that's a little ugly in my opinion monthly chart too had an inside bar bullish pattern though and it tried it popped up it went all the way up into this area and then came right back in right now we're down and sideways but still in a bullish manner above the Mas and the 200 so that's what's really holding this as well monthly 200 ma we get below that which is right at 1020 then we'll definitely be going going into the $758 level down in here so and then if it really starts rumbling you're looking at five bucks so upside again like I said you're looking at the 20 65 23 25 has got to get through the all-time high 1622 is a big area then the 1777 is a real big area so then the 20 Etc so still got to get above the last High which is the 1542 or so once it gets above that then we can see how high this thing can go if it slips here then there's some levels of it going down so just beware you know right now it's kind of in a 50-50 stance guys so it could go either way if the markets are a little weaker as you can see these will come down markets stronger these will go up markets stay complacent light volume spy then these can just go up or down or kind of do whatever they they need to do basically so you know what I'm saying with that all right AMD and then let's go into Tesla another one guys that just up and down up and down so let's go to the daily chart daily chart nothing really wrong still above the 50 and the uh 200 ma still below the uh 20 ma though so slightly bearish up here still above this trend line so still in a strong stance let's see what this little bearish pattern plays out hlls you need to get back above the uh 20 ma fill the Gap all-time high and I think you go to 400 possibly 425 if it starts going but you're going to go 405 4 10 415 stuff like that first so watch for 400 if we crack through that we should go higher and that's just going on oh my gosh here it goes you better get in Tesla so hope we'll be watching if you are not short this is the area right I mean even up here guys this is the area I want to start get interested in this bearish pattern starts to play out see if we get below this trend line 50 ma etc etc I still think we get back to the 200 ma most targets are the 200 ma guys or when the Trump rally began in November right here I still think I I'm telling you guys these are just out of control rallies right now this one te it's Tesla maybe 300 but uh 257 I have in the cards if this really starts giving it up we are going into earnings in July August with all these stocks so it's going to be a real interesting earning season in my opinion but the daily guys still okay still uh starting to chop around sideways and uh let's see what next week gives us weekly chart weekly close um a little bit ugly we had a nice reversal candle almost wiped out two weeks of gains in one week uh let's see if we get follow through guys here's that uh trend line let's see if we get back into this Channel next uh gosh you got you got a level around 337 then you got this support around 324 this will end up curling up too right now it looks like we have 335 or so in that area see if that holds up if this clicks over it comes right back in usually targets 20 ma which is at 306 but again we'll see nice move move up and then look they're just going to I hope they don't take it right down that's just that's just bogus but um we'll watch for this and then sideways bearish and then more downside or let's see if we just reverse right up let's see what it does next on Monday probably just chop but uh let's see what it gives us there and then of course July is uh 4th is Tuesday that will be off and then we'll see what we get Wednesday Thursday Friday on these that will tell us again that that's going to tell us a little bit more as as a technical uh technical Trader guys uh monthly chart chart on Tesla though a little bit extended from the 20 that's a 240 so I you know not a not a good a little bit of a tail not the best let's see what it brings us next uh next month does it retrace or does it start to just kind of slowly come back into reality that hey this thing should be a $250 stock no but the Bulls guys 400 once if it gets above there if and when then you want to see 425 450 you want to wait for pattern and stuff like that but you get moves like this straight up guys you got to get a little bit of a pullback I don't care what stock it is and then maybe you could buy the dip of course and then ride it for the next wave up so yeah Tesla guys nothing wrong back above the Mas a little stretched on the monthly though this is what I call a high flyer so be careful with that all right if you like these videos guy you'll get email alerts live sessions trade ideas little bit of education and hopefully a little bit of fun and you learn something here that's what we're here to do and uh hopefully I'm saving some people's butts too and uh giveing them good trades al


Comments 0