원문 보기
With the average of searching to new all-time highs, how do we search for any bargains? Are there Are there some left? Sure, but you got to know where to look for them. So, tonight we're going off the charts with the help of Carolyn Boroden, and boy she is that brilliant technician, and she runs the fibonacciqueen.com website.
She also happens to be one of my colleagues at realmoney.com, where I blog, to identify high-quality stocks that could still have some room to run. In environments like this one, Boroden looks for names that have yet to meet their higher time frame targets. And then she circles back to them. And what exactly the heck does that mean?
Okay, there's one pattern Boroden's noticed that seems to play itself out time and time again. Remember, her whole method, it involves measuring past swings in a security, and then running them through the prism of what's known as Fibonacci numbers. It's a series of ratios discovered by medieval mathematician Leonardo Fibonacci, that do repeat over and over and over again in nature, and also for some strange reason in the stock market.
And it's been proven by her time and again in the years that we've used her work, of which she is so much more right than wrong. And the pattern that matters right now goes like this. When a market experiences a crash, but its uptrend remains intact, we almost always see a 127, keep this number in mind, 127.2 Fibonacci extension of the corrective pullback.
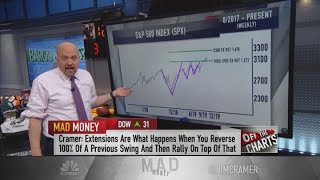
An extension is what happens when you reverse 100% of a previous swing, and then rally some more on top of that. This is why Boroden loves to use these 127.2% extensions as her initial upside targets when she's setting up a trade. That number keeps repeating itself. 127.2. How ubiquitous How ubiquitous is this pattern?
She literally sees it in action every day on the futures, on just about every time frame, even down to a 5-minute chart, where every tick represents a 5-minute interval. Get this. Let me give you an example of what the heck we're talking about. Take a look at the weekly chart of the S&P 500. All right.
Once this market started rebounding from its lows roughly a year ago, Broden gave us a new upside target. She told us the S&P was headed for the 3,102 market mark. At the very least. Why? Well, it was based on that 127.2% retracement of the hideous decline in the fourth quarter of the Powell bear market.
Sure enough, it took 11 months, but bingo, this November the S&P finally hit the initial target of Broden's 127.2. When she analyzed other swings on the same chart and put them through a Fibonacci prism, they gave a similar target with a cluster of important levels running from 3,083 to 3,102. Now that we've cleared the first major hurdle, Broden says the S&P 500 has another big picture price target around 3,308, up 3.6% from here.
While she acknowledges that short-term pullbacks are inevitable, she thinks these pullbacks will be viable as long as her big picture analysis remains intact. But if we're looking for buying opportunities here for stocks that still represent value, and we know that therefore she thinks she's going to give us this, but let's say we want to make, you know, some money in some individual stocks, which is what we like on Mad Money, even though we we totally respect index funds, we think they're the greatest, we sleep in bed with them, they're our lovey blanket, everything, but we like individual stocks in the show, too.
So, uh she says we got to hunt for some names that have yet to hit her initial upside targets, unlike this, which hit the upside target from right here. Hey, how about that call, right? She waits She waits out the Powell bear market and then zoom. I like when someone's right. Consider the weekly chart of Shopify, the cloud-based software company that gives small businesses the tools they need to create their own online stores.
From late August through early November, Shopify stock got hammered. Wow, look at that. Uh it fell from 409 to 282 as the fast-growing cloud stocks went out of style on the Wall Street fashion show. It was a brutal correction, but for the past 6 weeks Shopify's been rebounding rebounding like crazy.
However, it's only bounced back to 387 as of today. We've seen enough to confirm that the uptrend remains intact, but the stock is still a long way from making 127.2% retracement of this August decline. The August to November pullback hasn't been made up yet. As Broden points out, this 127.2 move in the wake of a correction is one of the most reliable patterns in the business.
Where does this go? 444 people, 15% from where it's currently trading. I do believe that Broden wants to get this even at a better price. But if Shopify gets hit again, she thinks it's worth buying it at weakness so long as it doesn't fall below the support of 200 of the 280s. So, what she's saying, just to be clear, she thinks it's going to go going to go to this level.
She's hoping to be able to buy it a little bit lower to get a bigger percentage gain. What other high-quality stocks still haven't recovered from hitting this correction? Well, how about Cramer fave Nvidia? While the chip maker's been having a terrific run lately, and no doubt that's because of gaming, but also because of t still hasn't recovered from the meltdown the fourth quarter of last year.
Meltdown took the stock down from 290s to 120s. And this was because crypto people were using them for crypto, and they couldn't tell what the inventory situation was, and also the stock got clobbered. Okay. Nvidia is just now testing its ceiling of resistance at 228, which represents a 61.8% retracement of the 2018 pullback, another very significant Fibonacci number.
If the stock can make a the 127.2% retracement extension though, then where does it go? Goes to 338, up 48% from where it's currently traded. That's where Broden thinks Nvidia's headed. So do I. My charitable trust owns it. Again, she's recommending that you wait for a bit of a a wee bit of a pullback uh before you pull the trigger.
Now, for the record, Nvidia, my dog, had an endoscopy today, and my 13-year-old rescue buddy is fighting kennel cough as best as he can. Please. Okay. That's apropos of nothing. But, I had to point it out. We see the same thing in PayPal's weekly chart. Let's go to that. The online payment kingpin got rolled over this year.
While stocks started rebounding to uh in October, okay? It's still got a long way to go to reverse that correction, doesn't it? Assuming PayPal can hold above its recent lows, mid-90s, the floor of support, okay? It's down 13 bucks from here. Broden believes the uptrend is intact, and if the uptrend's intact, PayPal, there we go.
127.2. Where does that go? 128. I'm talking about a 19% gain that we might be able to get. Shopify, Nvidia, PayPal, all fantastic companies. Finally, Broden's intrigued by the weekly chart of something in my charitable trust loves. The desk spot, Home Depot. This is one of the That's cuz one a developer I dealt with once called said to me, "You know what?
I'm thinking about buying a getting a home desk spot into my mall." I never forgot it. It's the one that pulled back the most recently. That company disappointed investors when reporting its latest quarter. It did disappoint, guys. They need to upgrade their legacy technology systems to bolster sales, and its stock, well, it just got crushed.
Broden's not convinced that a Home Depot's putting in a bottom yet. I do think it has, by the way. But, once we have confirmation it's done going down, what does he her methodology say? 217 goes to 247. Wowza. What needs to happen before she She give her home give Home Depot a blessing. Well, Broden's waiting for new buy signals against against the stock's floor support that runs from 202 to 209.
That's about 10 bucks from where it's currently trading at after a nice bounce today. What kind of buy signal? Well, she likes to rely on one potential signal when the 5-day exponential moving average crosses above the 13-day exponential moving average. Blue is five, red is 13. We're there, right? This is a sign that the stock's short-term momentum has turned positive after big decline.
And if we get it, Broden thinks we that will mean Home Depot's done going down and ready to reverse and go to the upside. Of course, not every one of these trades will be a winner. That's why Broden wants you to define your risk. If any of these stocks breaks down below their floor support, that means the uptrend has been called into question.
Her thesis is dead. So, if Home Depot falls below 202 for inches, trade over. Goodbye. Bottom line, even in a red-hot market, there are plenty of stocks that could have more room to run. And the charts as interpreted by Cathie Wood and Broden suggest that Shopify, Nvidia, and PayPal are all worth owning, especially if you can get them in a weakness.
And Home Depot might be able to join the list if the stock can show us it's put in a sustainable bottom. We should take calls. We should go to Lori in Pennsylvania. Lori. Hi Jim, this is Lori from the home of the Philadelphia Eagles. First, let me just wish you a happy holiday and a happy and healthy new year to you and your family.
And thank you for all you you do and your Action Alerts Club membership. I love it. Aw, Lori, you're very sweet. Thank you for being a member of the club. We've been having some good ones back to three mil, I think today. And one of the things I would point out is this that we have a really big game Sunday and we have to win.
How can I help? We are going to win. This is how you can help. So, anyway, just found out my mom went from Saks to TJ Maxx. So, I did what you used to do with your father. I went to TJ Maxx. I checked it out. Looked the parking lots were full. The employees were happy. The customers were happy. It was an incredible experience.
So, my question to you is with TJ Maxx trading near all-time highs, does it still have room to run like Miles Sanders? Okay. Oh, I like that. So, Lori, can I just ask Lori a question? Uh okay, what I wanted to ask Lori was, you know, it's not just TJ Maxx. You have You go to your HomeGoods store. You have to check out the HomeGoods.
What Pop and I always did was we never went to one store. He would drag me to five, six, seven stores. But, I will say I like TJX, and I think it does go higher. So, those trips, at the time they were dreadful. I said, "Oh my god, Pop, how many stores do we have to visit?" Darn it, Pop, were you ever right.
This is a red-hot market, people, but there are still stocks that have room to run. What kind of stocks? Shopify, Nvidia, not a dog, the stock, and PayPal, and Wingstop, and maybe even Home Depot if it puts in that bottom, you know, the crossover there. Now, there's much more Mad Money ahead. How a blowup in a little-known biotech company can offer larger lessons.
This is our lessons learned new segment in the sector. Don't make a move before hearing my take. Then, after such a big news for Boeing, wondering why its stock isn't lower, I'm telling you why that could be the wrong question. And we're going to call thiick 1-800-743-CNBC. Miss something? Head to madmoney.cnbc.com.




댓글 0