
원문 보기
Today, we are looking at and answering the question, are tech stocks overvalued? And is it time to rotate from the popular tech stocks into some of the less popular dividend stocks? And the way we're going to answer that is by looking at my absolute favorite investing tool, which is FastGraphs. Use it all the time to evaluate individual stocks.
And now they have launched the ability to evaluate ETFs the same way as you evaluate the fundamentals of stocks inside FastGraphs. So, you could do everything from looking at the price-to-earnings multiples, the forecast, which is something I do every single day, to even dig into the holdings of each ETF.
So, right now we're going to cover four ETFs that are have been some of my favorite over the years. We're looking at the QQQ, which is the Invesco uh it basically tracks tech stocks in the Nasdaq. We're looking at the SPY, which tracks the S&P 500, typically the 500 largest companies in the United States of America.
Then two of my favorite dividend ETFs, the Schwab US Dividend Equity ETF SCHD and the Vanguard Dividend Appreciation Index Fund VIG, which goes after dividend growth, which if you've followed my channels or my investing style for a while, one of my favorite ways to invest is in dividend growth stocks.
So, what's the point of all that stuff? Well, in the headlines on CNBC, different mainstream investing media, we're going to see a lot of excitement. We see a lot of green today, but all you see here is numbers that don't really tell you anything. The Nasdaq is at 1.66% on the day, but what does that actually mean?
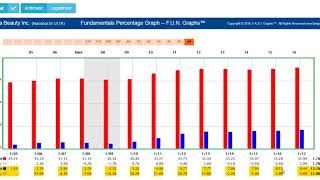
That's where I use FastGraphs to get past the headlines, past the excitement, past the doom and gloom when it's out there, and actually understand what's going on. So, let's dive into the QQQ first. So, using FastGraphs, we could see inception was 1999 during the one of the craziest excitement times.
Expense ratio 0.18% really not too bad at all, though there are a lot of cheaper ETFs out there. And right now, the price earnings ratio of the QQQ is 32.82. If you look quickly, you could see it is at the top end of the range since 2019 that it's ever been at since since then. The only time it was really higher than that was after the COVID-19 boom.
There was you got to remember there was a kind of a recession in earnings for a little bit and then everything got kind of really crazy cuz of century 0% interest rates, all the easy money, all of that stuff. And the PE got up to around 36, 37. And what you'll notice, so price was up to 339, 340. In the subsequent years after that, like things things were going great, things were going great.
Subsequent years after that, it actually dropped down in 2022 when rates increased down to 267, right? And so, that is a drop roughly of, you know, about 20% at at one point it probably down 30% from the high to the low. And that could have been avoided if you didn't chase some of the excitement that was out there and buy the QQQ essentially at all-time highs.
Well, fast forward to today, we are back at max excitement, all-time highs, and pretty much all-time high PE ratio for the QQQ. So, what's going to have to happen for the QQQ to continue to outperform? It is again trading at a current blended PE ratio of 32.82. If you jump to the forecasting tab, you can see that over century the next 3 years, earnings growth is expected to be about 26%.
So, if we go to the famous Peter Lynch price earnings growth ratio of one, that fair value ratio, putting it at a PE of about 26 out in 2028 from today's prices, you would get essentially a 15% annualized return. And that is if the PE drops down from a PE of around 33 today to the PE of 26 in 2028, but that's only if the QQQ and the companies that make it up actually hit those earnings projections of 34%, 25%, and 23%.
That is above the historical earning earnings projections. We are at pretty much all-time high of expectations. And so, in my opinion, it's more likely that we see these projections missed, which could mean returns are not as good as the projections seen on this screen. So, what's great about this new ETF tool in Fast Graphs is you can dig a level deeper, not only seeing the broader QQQ or the ETF and the price-to-earnings ratios, but you can see what companies make up each ETF, what the percentage weighting is.
So, in the QQQ, Nvidia is a 8.6% rating. Costco is in the QQQ, that's at 2.5% rating. And you can go through and you can look at the multiples of every single stock inside the ETF as well if you'd like. So, for me right now, the QQQ is looking expensive, and I'm wanting to look for other opportunities elsewhere.
Jumping into the S&P 500, the overall price-to-earnings of the S&P 500, again, we'll go a little quicker on this one, but it is actually more overvalued compared to historical norms and expected growth rate than the QQQ, which is kind of raises some yellow flags for me as well. So, we're looking at a current blended PE of 25.06.
The normal PE dating back to basically 2006 is at about 19, and so we are 20% or so above that normal PE right now. If we want to go to forecasting and we want to look and we go from today's price and we look if it trades back to that normal PE, closer to that normal PE, and then a price-to-earnings growth rate of one with 19.9% expected earnings growth, then you get a annualized return of 10.6% from today's prices.
Again, that is if the S&P 500 and the companies that make it up hit those heightened EPS growth projections over the next few years, which are well above what they have been historically. A 11.6% annual return 11-ish% annual return is not bad, but for me, I like to think about what is the risk reward there and are we likely to come in above or below the earnings projections?
And I would think, just based on all the excitement in the market, again, more likely to come into the downside. And so, I'm wanting to look at options outside of just the QQQ and the SPY. Again, quickly looking at the holdings, so there's some common holdings here between the S&P 500, SPY, and the QQQ.
Nvidia, Apple, Microsoft, Amazon, Alphabet, all of those are also in the QQQ. So, where am I looking? And this isn't a recommendation, but just ideas of where you can look for value in today's market. Some of these dividend ETFs have underperformed because they don't get all the excitement, they don't have all the AI stocks, and people really haven't cared about dividends lately, which for me is a great time to be looking at dividend ETFs and dividend stocks.
So, SCHD, currently trading at a blended PE of 15.73, dating back to 2019. And just look at how much lower that is than the SPY and the QQQ, especially. But, that's right in line with its normal PE ratio since 2019. If we want to go to forecasting, and again, look at this out. So, with much lower expectations, just a PE of 15 in 2028, you're looking at 9% annualized returns.
And while you're holding this ETF, you're also getting a 3.3% dividend yield, which gives you some nice dividend income there as well. And you're going to notice a big difference in the types of companies that you will have exposure to owning SCHD versus the QQQ or SPY. And this could be a great option to own alongside those two other ETFs or as a safer portion of your portfolio.
But, you've got Lockheed Martin, Conoco, Verizon, Chevron, Bristol Myers Squibb, Merck, Altria, Texas Instruments, Coca-Cola, PepsiCo, Amgen, Home Depot, that's kind of rounding out the top 10 or so largest holdings. And you'll notice bit smaller weightings, instead of in the 7-8% range, the highest holding allocation is 4.8% for Lockheed Martin.
And a lot of them come in in the threes, the twos, and even 1% allocation. So, if you're looking for more for dividend growth, which tend to mean these companies are in growth phases more so than stable dividend payers, you'll notice a lower dividend yield, 1.47%, but this is going to have a higher dividend growth, which a lot of investors, including myself, tend to like.
You're looking at a current blended PE of 22.75 versus its normal PE ratio of right around 22 since 2019. Jump over to forecasting based on expectations. If we go down to a PEG of one, then you're actually looking at -1% total return. But, if it stays around, you know, 19 to 22, then your total return at 19.5 is going to be about 10% per year.
And let's check out the holdings in here. You do have some tech exposure here, which is a nice mix, but then you've also got some stable dividend payers and dividend growers. You got Broadcom, Apple, Microsoft, Eli Lilly, JP Morgan, Exxon Mobil, Johnson & Johnson, Walmart, Visa, Mastercard, Costco, AbbVie, Home Depot, and other kind of more stable industrial and financial stocks as well.
So, just wanted to share some options. It's looking like the QQQ, the S&P 500 are potentially overvalued. So, if you're looking for some different options, might be a good time to consider some dividend ETFs that are a little bit out of favor, but either way, in my opinion, the best way to look at the fundamentals of individual stocks, the fundamentals of ETFs now, which I couldn't be more excited for, is using FastGraphs, my favorite platform to analyze fundamentals in stocks and save a ton of time every day. Thanks, everybody.


댓글 0