저자: NelsonMolina · 외국인
요약 보기
결론: 시장은 여전히 강세로 보며, 손실 관리(포지션 크기 2~5% 분산)가 핵심이라는 교훈 제시. 지수 분석: SPY는 저항 돌파 후 240 부근 돌파를 기대하며 245 목표. 다우(DJIA)는 210~211 돌파 시도 중이라 강세 신호로 봄. 러셀2000은 139 재테스트 후 145 방향 상승 전망, 단 일부 지지선 하락 가능성 언급. 개별 종목: 특정 종목(자막상 명확하지 않음)은 지지선 붕괴로 944 또는 7~8달러 수준 하락 가능성 언급하며 진입 금지 권고. 애플: 실적 후 시간외 148 목표가 상회 후 하락, 143 부근 반등. 140~144 지지 테스트 전망. 과거 대비 변동성 약화. 페이스북: 다년간 채널 상단 도달, 실적 반응은 미미. 실적 스트래들 전략은 손실 위험 경고. 리스크/교훈: 차트 해석 능력과 무관하게 손실 거래는 발생하며 20~30% 손실 가능. 종목 손실 관리를 위해 매 거래 동일 금액(2~5%) 배분 권장. 하락 중 물타기는 장기적으로 손실 위험. 시장 심리: VIX가 저점 근처에서 하락 중이라 공포 부재 신호로 해석, 상승 추세 유지 전망이나 VIX 급등 시 하락 경고.
다듬은 글
hello traders this is mike billion today is may 2nd 2017 and let's talk about the market so i'm going to talk about the three benchmarks the spider the dow jones and the ice chairs russell's let's start with the spider as you can see here we break out this major resistance and we use moving sideways about the five simple moving average and about the 21 double exponential which is my momentum um moving average and you can see here there is no volume yet but as soon as we break out this little range right here about 239 there is a resistance at 240 65 and dmi is bullish and is now very strong so there is high probability that we continue break out this level and continue to 245 so let's see what happens now let me show you the downhill the down jones is polish as you can see here this chart is doing the same you break out this triangle wedge and it's moving sideways dmi is bullish no volume yet but i think it's going to go up to 210 to 11 and then we'll see there if they wanna the bulls wanted to break out the 210 level so to me right here this is bullish is just moving sideways waiting for some momentum and for the other one that i wanted to talk about is the ics russell he also break out the fibonacci 139 he tested the 142 but it looks like he fails and now he's testing the 139 breakout point again i think is bullish it might go down to this major support on trend line but dmi is bullish and is a strong so i think is just is just moving sideways here for two days and then it's gonna continue up to the next level will be 145.
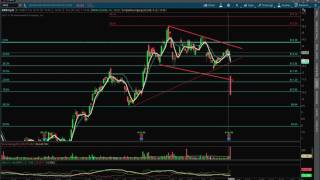
now let's talk about this one this one was my darling i was following the stock i was the chart looks really bullish you can see this chart making higher highs it was just consolidating here and i say 16 or 80. i was wrong he breakdown horrible and he test the 10 55 like butter and he break down the level 2.
so now that i look at the chart there were as there was a signal that i missed so before earnings price didn't test the 14 level so that was a signal that it was weakness somebody knew something they don't want to they don't want to buy here and and get it to the to their system it was just hanging in there so that was a signal that i should see that the stock was going to break down because usually when a stock is strong they usually go to resist them and wait for the report there but didn't happen here it just went bounced from this level of support but it never made it to the resistance right here so that was a signal that i should see that it was gonna it was gonna go down so you know it doesn't matter how good you are reading charts you always gonna have losers and i always gonna i'll always get losers about 20 to 30 percent when i'm doing really bad so that's what you have to keep them down and do you know you have to get more winners than losers but you always gonna get winners so the lesson here is you always have to use money management if you allocate the same amount of money let's say two to five percent on each trade you're never gonna burn your account it doesn't matter how good this trade looks you never put a lot of money in any trade it doesn't matter how good it looks on the chart on the fundamentals always put the same amount of money and you always keep your account in check so you can trade next day so to me here is broken as hell it's broken as hell i think it's gonna go to 944 which is support now and if that that one doesn't hold it's gonna go to seven to eight dollars so probably 650.
for now is broken it's broken you know there's a lot of people saying i'm gonna enter here never enter not on um and i break down like this you know usually those people that trade like that buying um deep uh dip dips they never make money they can make money one day but they want you know the rest of the trades they lose a lot of money so it's better to wait until you see consolidation and move a breakout but never enter a trade like this never this is a no-no now let's talk about apple apple report today and you can see here when he went after hours nicely to 148 which it was my target uh and it break down so the lowers it went down it was 143 82 but it bounced a little bit here and i think it's going to go to 140 to 60 64.
this is the major support then there is a trendline support let me show you the trendline support apple is not a big mover anymore it was if you remember apple apple was a big mover um a couple years ago you can trade earnings very nicely but not anymore so you can see here when nicely to 148 but now i think it's going to test this support or the fibonacci 142.
so let's see what it you know what the bulls wants to do there they want to keep going up or they're going to break down now let's talk about another one let's talk about facebook facebook as i said went to the top this is a major major uh multi-year channel and it went right to the top of the channel so i think report after hours i didn't follow because i took my i took my premium and my profit out so i didn't follow to see an apple i got puts before the market closed so i don't know how they're gonna open so you see the the the the report didn't do much it just went up a little bit so it's just flat so if you know people trade the report with uh straddles or triangle they're gonna be lost losing a lot of money so the vix the vix is a fair indicator and you can see is almost at the lowest levels and it's pointing down meaning there's no fear is this is another team that i used to trade you know usually when the when these are the lowest levels you can enter uh loan trace but if you see that is spiking it's moving up is pointing up it's a it's a signal that the market is going to break down or is moving down slowly so this one is pointing down and it's at the lowest level or near the lowest level so i think it's good to get loaning here is market is still bullish don't believe anybody that says that that market is bearish is bullish of course you're gonna get breakdowns you're gonna get uh stocks that move down but the game here is to go long as as soon as the market uh like in the spider goes to 240 then you have to see what's going to happen you have to watch volume okay traders check out um mcbillion join mcvillian you can learn with me you can trade with me check it out this is everything for
Comments 0