저자: tradesight · 외국인
요약 보기
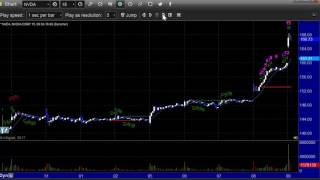
영상 결론: 바 카운팅(Dual Comber 13) 지표는 큰 가격 움직임 후 소진점을 알려주며, 엔비디아 15분봉에서 상승 후 하락 반전을 포착할 수 있다는 사례 소개. 지표 개요: 이 도구는 작은 움직임이 아니라 큰 극단적 움직임에서 소진 포인트를 주며, 양방향 모두 활용 가능하다고 설명. 시간 프레임: 15분봉이 5분봉보다 크고 60분봉보다 작아 하루~이틀 단기 매매에 적합하다고 설명. 엔비디아 사례(금요일): 초록 1~9 카운트 이후 분홍 13 신호 발생, 갭상승 후 소진 신호로 판단해 단기 숏 진입 제시, 손절은 당일 고점 위. 엔비디아 하락 전개: 167달러에서 약 140달러까지 하락, 금요일 장 마감 무렵 반등, 월요일 시가 갭하락. 월요일~화요일: 상승 13 소진 신호 이후 급락, 저점에서 13 매수 신호 발생, 이후 반등 가능성 언급. 리스크: 지표 신호는 모멘텀이 실제로 있을 때 유효하다고 강조, 과거 사례 중심이며 수익 보장 언급 없음. 출연자 전망: 엔비디아는 단기 숏 후 저점 매수 시나리오를 제시했으나 명확한 중장기 가격 목표는 없음.
다듬은 글
hello this is a trade site trade recap we wanted to talk a little bit today about our bar counting tools that we show all the time and what these tools are really designed for is to give exhaustion points in the market when you get bigger moves it's not about the smaller moves it's about it's about a big extreme move and what's nice about those is that sometimes when you get a decent move if it's big enough you'll get a swing back the other direction and this tool can actually help you play that both ways so I want to give an example of this because we've had some volatility the last couple of days and I want to give you an example of the count working for us not just on one way but the other so here's a look at the Nvidia NVDA 15-minute chart and I like using this tool on the 15-minute time frame just because it's a little bit bigger than something like a 5 minute which is a fairly small time frame which means once you get the signal it can last for the better part of a day or more but it's not so big that you know that you run out of time and you have to hold the position overnight every day because this is really you know usually about people looking at very short-term trading like within a day maybe two days tops and you take a signal on a 60 minute time frame it and it turns into a week long trade so I really like the 15-minute time frame for this and as you recall the green numbers that you see here are just the opening salvo if you owe the beginning of the count what we're really looking for are the pink or magenta numbers and I'm going to actually go through this count this was just back on the Friday ok and let's take a look at what Nvidia did so we get first this when playing the day forward basically at this point so there's the 9 bar start up that's the green 1 through 9 and because of that we get the magenta or the pink numbers which is the actual thing that we care about what we're looking for is that to get to a 13 and that's going to give us the exhaustion point so let's keep moving forward and I'm going to go again remember every one of these candles because a 15-minute candle so there's count 9 and account remember we there's certain parameters as to what gives you these particular numbers and it's a it's a way of looking at the bars before it to determine if you're getting near exhaustion so I'm not going to get into the math here what I really want that's just how it works so there's our ten and you can see there's a bar 11 we come up to the end of a trading day boom bar 12 and that's fine now see how we then get a gap up so this stock compare it to all the other days you see on this chart for like six and seven days it was fairly tame fairly flat we're finally getting a little bit of energy which is why the count actually was able to play out this time and then we get a gap up on top of it so the stock has made a very big move over the course of two days but what this does is I finish this first candle of the next day and sorry that was Thursday first this is Friday the 9th look at that on the open candle then with that big gap and push up we get the 13 exhaustion so what that means is because we did have a decent move to lit that led to that we would anticipate that this should be the high for a while and NVIDIA and we look to go short let soon as we get a candle that rolls over and there's the candle right there so you can get short on the Nvidia right there on that candle and your stop would be up above ok the highs of the session so far and let's just keep moving forward so how does this play out from here all right so now because we're moving back down now we're going to get a new green count to the downside and and again you know you'd see yourself well ok I mean we've already made some money you know this is working this is good but there are two ways that this can play out typically one is that if we get back to that read static trendline that red line below that would fulfill the signal and that would actually be a decent move that goes from 160 maybe we got in a hundred sixty-seven and it takes us all the way back to 153 so that's a decent movement in video the other one would be if you get a new green count to the downside but Friday ends up being a day with some very big volatility to the downside as you recall it really sold off hard on the leadership stocks so right there there's the new 9 bar count and look how perfectly this worked out we got the green 9 bar start up count to the downside and it also brought us when we got that to the read static trendline so the question becomes alright are we done with the short should we be out of the short but what's interesting here is because we've got some momentum in the market we're now seven candles into a new comer that's the magenta numbers hound looking for a 13s let's stick with the train a little bit longer and see how this momentum plays out and what you'll find here is as the rest of the day wraps up see how we're at ten now look where the stocks at we're down under 144 and we got the twelve and here's the thing we're going to run out time for the day I wouldn't blame anybody at this point for taking the trade off the table anyway because you've done pretty well here I mean we up from 167 down to a low of 140 two and a half and you get a bounce-back because it's the end of the day on Friday right people are going to close out their short positions nobody wants to hold it over the weekend necessarily but let's just what happens if we had what happens if we had held out for that trade into Monday so here's Monday starting that's the little gap down and when we complete this first candle on Monday look what happens the exhaustion by signal 13 by signal on NVIDIA on the 15-minute time frame Monday to start the week and then let's take a look how does it play out for there and I'm going to speed through now Monday and into Tuesday which is where we're at right now look at that so first we have the 13 exhaustion signal up top after two days of decent movement and then the reversal and the market starts to roll really hard and we end up with a 13 buy signal exactly at the low so now you can play that one if you want but again when there's actual movement and momentum that's when these tools are going to be the most useful because you get two extreme levels that can't be maintained and they're designed to give you those exhaustion signals this has been a trade site trade recap
Comments 0