
저자: SergeBerger · 외국인
요약 보기
엔비디아(NVDA)가 극단적으로 과매수 상태라 단기간 내 평균회귀(하락 조정)가 임박했다고 주장하는 영상이다. 핵심 주장: 주가가 이미 가파르게 오른 뒤 수직 상승할수록 평균회귀의 폭이 커진다는 '중력' 논리를 펼친다. 2013년 저점 이후 완만히 상승하다 2015년 가을부터 수직 상승했다고 설명한다. 근거 수치: 2025년 2월 저점 이후 약 90% 반등했으며, 5월 13일 이후 21일 이동평균선 위에서 거래 중이다. 작년 12월~2월 조정 때는 약 30% 되돌림이 있었다. MACD 오실레이터는 역대 최고 과매수 수준(2011년보다도 높음)이라고 언급한다. 목표: 발언자는 주가가 40달러 초반까지 되돌아갈 것으로 본다(목표가 약 40달러대 초반, 기간은 명시되지 않음, '머지않아' 평균회귀할 것이라는 표현). 조건/리스크: 과거(2011년) 사례와 현재는 상황이 다르다고 인정하며 단정은 피한다. 추격 매수 대신 조정을 기다리거나 숏 기회를 노리라는 취지다. 영상 말미에는 인스타그램 팔로우를 권유한다. 출연자 전망: 단기 하락(조정) 쪽에 무게를 둔 약세 시각이다. 다만 기간 특정이 없고 조건부 표현이 섞여 있다.
다듬은 글
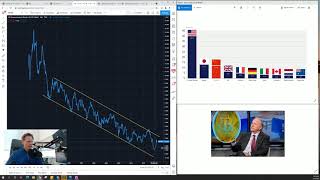
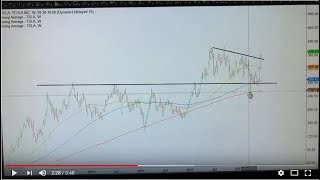
hey guys so today I'm going to show you guys a stock that I think could quite possibly be one of the most severely overbought stocks at least in a near term um when we talk about stocks being overbought it is important to keep in mind as a principal and it's something I always talk to clubhous members about is that gravity Works uh just like it does around us here it works in the stock market so when something goes up too much ultimately it does come down and mean revert and um that's important to keep in mind uh as far as not chasing things higher into the stratosphere make sure you wait for stocks to consolidate uh or in the case of what we're going to look at here in just a second is basically uh giving us an opportunity to actually play the short side of it so let's have a look at the charts all right guys so the stock I'm talking about is and Nvidia nvda and this stock if you look at it just uh on this multi-year chart you can see uh what has been a fairly orderly incline basically off of those lows in 2013 orderly inclin and already quite steep uh basically turned into an absolute Monster uh vertical leap starting in the Autumn of uh 2015 if we zoom in a little bit closer you can see how this this slope has constantly uh and steadily basically uh increased in steepness and even though we did have a nice corrective move here last December into the February lows we've seen a massive massive nearly 90% rally off of those February lows of this year and you can see how this last move here has been we've now seen on a on a weekly basis and of course this week here as I'm recording this the first week of June is not yet over but so far we've seen three up weeks in a row like big up weeks in a row so this gets back to my point from earlier in the video on gravity the more stock goes vertical after having already steepened and this is the key point after having already increased at a fairly steep rate the more it goes vertical the more dramatic ultimately the mean reversion becomes if you look at Nvidia here in the daily on this on this weekly chart in January December into early February I should say you can see that the stock actually retraced 30% and you know that's a pretty big steep steep retracement so the same thing I think is um is happening again here we look at Nvidia through a daily lens now and you can see if we make this a daily chart how far how steeply how far removed this stock has now become from all its medium-term moving averages so the 200 day 100 day and the 50-day you can take this you know a little bit um closer up still and you look at the 8 and 21 day moving averages this stock has now been trading above its 21-day moving average uh since the 13th of May so that's actually you know that's actually okay that happens but look how far moved it is even above its 21 day moving engine and how and how sharply up sloping these these these moving averages are so um you know this is a fairly simple way of looking at it but I I really believe you don't have have to make it much more complicated than this so in essence what this translates into is this stock ultimately is going to mean revert I'm thinking it's going to me invert back into at least the low 40s uh from what I'm seeing here now if you want to look at this a little bit more also maybe from a um momentum perspective we can look at things like the macd oscillator this represents how far removed the stock is above its certain moving averages and the macd actually right now as it its is at its alltime ever overbought ratings in the stock even high than it was in 2011 and just to kind of to make my point in 2011 you can see that this stock actually uh came falling down quite significantly after it was this severely overbought I'm not saying that's the same there was a different time of course in this in in that company's uh order orders history and trajectory and all that but this stock NOW is certainly very very overbought so um that's what I'm looking at at at uh at here today and I do think the stock here sooner rather than later is going to uh mean reverse as we call it uh fairly fairly fairly uh aggressively also guys please be sure to follow me on Instagram to get more free tips and tricks on how to become a successful active investor and trador so follow me on Instagram


댓글 0