원문 보기
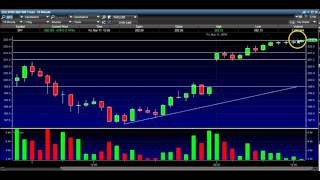
11th 2016 midday market report we're going to take a look at a bunch of intraday charts here I'm going to go over about five or six charts here A bunch of uh charts that I'm seeing in the market uh but first if you're not already a member at the conclusion of this video go ahead and sign up it's free market analysis daily watch List not only giving you the alerts we're explaining the how the why the what and the when of every single trade that we put on so that you not only make money in the market but you learn how to uh first I'm going to take a look at the S&P 500 as you can see here uh we've got support at about 20160 uh from the lows of these candles right here and the highs of all these candles right here again this is the 15-minute chart and then we've got resistance right here at about uh 2023 35 20240 that we're running up against right now so break over that uh would be bullish that would be the next level okay as it stands right now we've got one two three 15 minute uh spinning top Doge's right at that resistance so it uh it looks like it's it's definitely taking a pause here we'll see what this next candle does but a break over that uh level right there would be the next step and then that would become support uh let's take a look at Apple here uh Apple uh broke through support right here with this 15minute candle it closed below support as you can see the open of this candle open of this candle the low of this candle open of this candle close of this candle almost the low of that candle so this uh level of support uh which is now resistance uh is going to be is a key level obviously because uh the chart is showing you that so uh We've also got a downtrend line right here so as it stands right now apple is below support looks like it's going to fill that Gap at about 10120 we'll see what happens uh taking a look at uh Netflix here uh I want to expand it out here so I can see seven days uh major support here uh you know shortterm support right around 9540 we make our way down there uh I believe we could get at least a short-term bounce um let's see Tesla here Tesla I'm going to look at uh right here okay so we've got uh really shortterm uh uptrend line that was broken um and then we did close below this support right here we're kind of puttering around at it uh currently we'll see if uh it ends up uh uh continuing to be an important level um but that the level that I'm seeing right now and that is right about right about 20660 okay so 20660 is that uh support that I'm seeing on uh Tesla and then resistance we've got right around here from the highs of all these candles right here about 208 okay 208 resistance uh 20660 support and last but not least Twitter uh Twitter we've got this uh resistance right here from the highs of all these candles I'm going to move it up just um a break over that would be a bullish short term uh but I believe that if it makes its way up to about 1750 that should have some trouble getting over that we've also got this downtrend line we've also got this downtrend line right here that's going to match up right around that uh resistance as well so we'll see what it does uh from there we've got support right around 1650 okay 1650 support about 1680 resistance uh 1750 resistance up there as well thank you guys for stopping by I appreciate it as always hopefully this video will help you out in your trading or investing in the stock market again you can join us for free can





Comments 0