저자: 미상 · 외국인
요약 보기
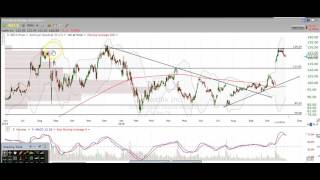
Apple(AAPL)은 상승추세선 이탈 후 하락추세가 유지되고 있으며, 10250 부근(200일 이동평균선 포함)에서 반등 가능성을 보고 있고 현 시점에서는 보유 이유가 없다고 봄. Tesla(TSLA)는 4월 이후 하락추세이며 박스권 하단 이탈 후 재테스트 실패. 상단 저항 129.25 부근에서 거부되었고 단기적으로 121.70 지지 확인 시 단기 반등 가능성은 있으나 하락 압력이 남아 있다고 봄. Google(GOOG)은 돌파 후 가짜 돌파(false breakout)로 판단되어 지지선 이탈 및 재테스트 후에도 하락 여력이 남았다고 보며 787~788 부근을 저항으로 설정. Facebook(FB)은 2014년 이후 채널 하단(약 120)에서 여러 차례 반등해 온 핵심 지지선이며, 이 지지가 깨지면 크게 하락할 수 있다고 봄. 종가 기준으로 이 레벨 유지가 중요. Twitter(TWTR)는 볼린저 밴드가 매우 좁게 수축된 상태로 방향성 돌파 대기 중. 18.50 일봉 종가 돌파 시 상승(1차 목표 약 20달러), 17달러 아래 마감 시 하락(약 15.75 재테스트 가능성)으로 제시. GoPro는 상승추세선 이탈 후 숏 관점을 유지하며, 12.50 저항에서 거부 확인. 과거 핵심 지지였던 레벨이 깨졌기에 추가 하락으로 약 9달러 재테스트 가능성을 제시. 전체적으로 발표자는 기술적 차트 분석만으로 충분하다고 강조하며, 각 종목별 핵심 가격 레벨(지지·저항)과 돌파/이탈 조건을 기준으로 매매 판단을 제시함. 단기 가격 조건 중심이며 이에 따라 리스크 관리 필요. 리스크 및 조건: 각 종목의 예상은 특정 가격 레벨 유지·돌파 여부에 전적으로 의존하며, 시장 전반의 흐름(특히 지수 약세 여부)에 따라 결과가 달라질 수 있음.
다듬은 글
everal of the big names here in the market and I'm going to give my analysis and we're going to go over my thought process so hopefully the idea is for you to come away from this video with some new found be able for those of you that have full-time jobs or maybe you jus still going to get daily going with so first to recap here we liked Apple for a long on this retest over here we took profits up here near these highs I've covered many times why we took profits there it ended up being a short-term top at this moment it could be uh the top um in the near term but we don't know that yet um but we also liked it for a short once we broke this trend line right here so that was right here we liked it for a short congratulations if you've been following along and profiting nicely on this short for Apple so now where is apple headed well Apple could be headed lower I do not really see any signs that a bottom uh has been met just yet okay we broke this uptrend line here's a touch there's a touch there's a touch tried to bounce off of it here and then we broke below it right here we ALS Al closed below a support so this was former resistance right here and we closed below that level right here we didn't get any kind of a buying candle just yet uh we are in a downtrend at this moment in time um and it needs to prove itself in order to come out of that downtrend so where can apple potentially Bounce from so some levels lower here where I think have a a higher probability of a bounce zone than where we're at right now are a little bit lower about 10250 and that's based off of this low right here and these lows right there that's also that touch up here so that could potentially be um a level that we bounce off of uh in the future is also the 200 day moving average as well so that's something you want to pay attention to as well so we'll see how it reacts to this level but in the meantime right now I do not see a reason to own Apple for a long at this current time so we'll see how it reacts uh this coming week and I'll keep updating you on the progress of this chart the next one we're going to take a look at is Tesla so Tesla as you can see we're going to zoom out a little bit so you can see this pattern here so you can see we've been in Trend since April of this year several touches against that downtrend line here's a touch here's that earnings day that tested it right there and got rejected big time now we not only have that downtrend but we broke below this little box we've been trading in a box right here and we broke below it and we retested it on Friday right there believe this trend will continue to the downside and this 19380 or so level is the level that you want uh Tesla to hold below in order to remain uh in a bearish level I've been mentioning excuse me I've been mentioning this level up here about 129 12925 and you can see it was the previous highs right here right here and then low and behold that's exact where we rejected at this time I liked it for a short since it hit that level this is not the most bearish stock at the moment obviously but this is definitely a level to be uh paying attention to right here so I think that we'll continue to see some consolidation to uh the downside um and what I mean by you know there's a difference between a downside move and just some consolidation so clearly this is a big breakout here um and we have to treat it as such in the moment so right now we have some levels to trade against 12924 and then just recently and I'll draw that right there we're developing a little level right about there about 12150 you can see how many times we retested it or we tested it right there I'm going to move that up so it's about 12170 the lows of the last 5 days right here so it looks like potentially we could see um some upside here in the short term so very shortterm um analysis right here for this level just because of you know the curled look to it so you want to see it hold 12170 and if we get some kind of green uh candle action we can definitely see some uh upside movement in the short term but just remember we still have have resistance up here from all these candles right there that I've been mentioning befo and Google um congrats if you've been following along on the videos that I've been doing on Google so let me rehash uh what we've been thinking on Google so Google this was a nice breakout here or at least it looked like a nice breakout here and we liked it for a short once we broke below this level right here so this was the day that we liked Google for a short because we closed below that breakout level so there was that resistance resistance resistance resistance and so this looked like a breakout and the close below this level ended up being a false breakout so false moves lead to Swift moves in the opposite direction so what does that mean so false moves so this is the false moves and now that we have deemed it a false move right here it's going to move Swift in the opposite direction and that's what we've been getting another thing to mention here is that we broke below this support level that we've had for a while here we tested it on Wednesday's action and then closed below a Thursday came back up retested it on uh Friday so it looks like Google still has some downside left in it because of this additional close below the support so you can use this level as resistance about 787 788 is that level right there the next chart we're going to look at is Facebook and Facebook right here another thing you know that led into uh this earnings announcement so we had that breakout okay another false breakout right here and then we broke down uh from that earnings reaction typically charts tell the story you don't need to look at uh any kind of balance sheets or or anything like that um in order to make money in the market you can just look at these charts because they tell you the story so now let's look at I'm going to back it out to the weekly time frame here on Facebook and you can see that ever since early 2014 we've bounced look at how many times we bounced off of this level right here right here right here again right here you can see this is a channel too so here's the top side of that channel as well so it's a good idea to draw this level on your chart so as you can see right here and I just want to clarify right here you might be thinking oh that candle broke through it well no it didn't because this week opened below but ended up closing Above This channel so that's what matters is the close of the candle so the close of that candle is right there so now look at right where we bounc and I've been mentioning this level uh many times here so this is a make or break level here for Facebook if Facebook does not hold this channel then we're going to be heading much lower here so we have to assume that this level will hold okay so the trend like everyone says and it's very true the trend is your friend so in until this breaks we have to assume that Facebook is likely going to get some kind of bounce around this area so we're going to look for see how it reacts to this level about 120 or so is the level you want to see hold on Facebook in the near term if it breaks below that Facebook is in trouble it's also going to be below the 200 day moving average so that's something to note as well so pay attention to this level on Facebook you should do just fine the next one we want to take a look at is Twitter and Twitter has a nice little setup here um for really either direction so you want to look for either a break over this 1850 and by a break I mean a daily close over that level you can see how this uh Binger bands are extremely tight very tight another thing I want to mention here for Twitter is while the market um has been declining in Facebook has been trading sideways here so if we get a little bit of positive action in the market uh then I really think that Twitter can break out to the upside so that's the level that you want to see uh Twitter close over in order to head higher if it heads higher first Target would be about $20 for that Gap fill right there on the downside if it closes below $17 then it's going to be heading lower and it's probably going to hit that uh this previous low right here at about 1575 okay so squeezing very tight you can see I drew this box for you you can see it really nicely we've got this uptrend line right here lots of touches against this uptrend line lots of bounces so we'll see if it ends up breaking over this level um that's definitely a level that you want to see uh break out on Twitter if you're bullish on this stock the next one we're going to take a look at is GoPro if you've been following along these videos with GoPro we've liked GoPro for a long for a long time ever since it's been bouncing off these trend lines and then we liked it for a short ever since it broke below that trend line you can see it broke it right here and then came back up retested it and then got rejected right here so congrats if you've been following along with that GoPro uh short trade so now what do we do with GoPro well GoPro not looking great obviously and we can use this 1250 level as a level to trade against this is a key it was a key support you can see it bounced off of it right here several times right here it held for a couple of days and then it broke below it so this is a key level also on Friday we came back we gapped down we came back up to that 1250 and look at where it got rejected at the high of the day at 1250 so uh that that is a level of resistance and I believe that uh GoPro still has lower to go more than likely eventually is going to retest these lows down here near about $9 you can see it tested it here as well as right here so we'll see what happens we'll keep updating you um on this chart uh as as the price uh progresses into further action uh mmediate





댓글 0