저자: 미상 · 외국인
요약 보기
결론: 진행자는 PCLN·GoPro·TSLA·GOOGL·NFLX·FB·AMZN·AAPL 차트를 분석하며, 개별 종목 중 GoPro와 Tesla는 강세 쪽, Apple과 Facebook은 중립에 가깝게 보고 있다. [프라이스라인(PCLN)] 실적 발표 후 큰 갭하락과 거래량 급증이 나타나 1800~1820 지지선 이탈, 상승 추세선 이탈이 확인됐다. 1750(50일 이평선 부근)이 핵심 지지이며 1950 갭 메우기 가능성을 언급했다. 단기 반등은 가능하나 장기적으로 약세 경계. [고프로(GPRO)] 1년 가까이 횡보 후 주간 50선 돌파와 거래량 급증으로 바닥 확인 판단, 입장을 강세로 전환. 1090 위에서 유지되면 강세 유효, 상승 시 장기적으로 큰 돌파 가능성 언급. [테슬라(TSLA)] 추세선 돌파와 거래량 확인. 384 부근 저항에서 조정 가능성, 360 부근 재진입 매수 구간으로 제시. 단기 옵션 트레이더는 차익실현 구간으로 언급. [구글(GOOGL)] 갭하락과 추세선·20일선 하향 이탈로 약세 흐름. 다음날 갭상승 후 전일 고점(941.75) 돌파 시 강한 매수 신호로 제시, 972~975 목표 가능. 실패 시 지지 재시험 예상. [넷플릭스(NFLX)] 저항이 지지로 전환된 구조. 179~180 부근 하락 시 20일·50일 이평선 중첩 구간을 매수 기회로 언급. [페이스북(FB)] 약 2개월 횡보 중. 174 돌파 시 상방, 165 이탈 시 155까지 하락 가능성. 방향은 불확실하다고 명시. [아마존(AMZN)] 저항 돌파 후 인사이드데이로 에너지 응축, 1020 부근 상승 가능성 언급. 실적 갭하락 레벨은 아직 하방 경계선. 상단 저항에서 역망치형 후 재하락 시 숏 신호 가능성 제시. [애플(AAPL)] 단기 추세선 이탈 후 혼조. 158 지지 이탈 시 154까지 하락 가능성 언급. 진행자는 명확한 입장 없이 관망. [출연자 전망] 진행자 본인은 GoPro·Tesla 강세, Google·Apple 단기 관망 또는 약세 경계, Facebook 중립, Amazon 단기 반등 후 재확인 필요로 정리.
다듬은 글
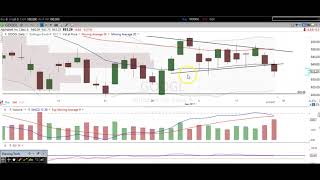
face Priceline and want to focus on a couple levels here on Priceline you can clearly see we reacted to this level down here in about 1800 to 1820 you can see who's previous resistance their support their support here support here so is a big time level so we bounced off of it for quite some time here you can see we're still above that level so about 1820 to 1860 and then the following day both with very large selling volume dates alright we also came down here into this 30 below this 30 RSI level it doesn't really do that that you don't really want to see that happen on a stock that is supposed to go up so a strong stock tends to stay above that 30 RSI so volume as well as gapping lower on that earnings it's something we've seen before and you can clearly see we also broke this trendline that started here in 2016 gotta bounce right there gotta bounce here bounce here bounce here and then you can clearly see what a coincidence we gapped down just below that trendline and you can see we're still below that so overall you just want to be aware of that in the long term doesn't mean we can't get some bounces here in the short term but just be aware we've got resistance up here in 1908 we gapped down huge on earnings you know earnings is what moves stocks obviously other things have some influence on stocks but earnings is you know the most pure form of looking at you know the health of the company so we broke below that trendline here huge volume definitely want to be aware of that and also of these shorter terms support levels right here and then that resistance up here at about 1908 the next one tha here we are we called for a breakout over this high right here into this gap we got just that now this level is going to be a level of support so if we do head lower which it seems like we can we're gonna have support right here at about 1750 also right here at 1750 is that 50-day moving average you can't see it because this support line is there I'll just move it so you can see it there's that 50-day moving average the red line right there and here's that 20-day moving average creeping up as well and they're both going to be right there around 1750 so definitely want to pay attention that 1750 level because most likely we're going to get a balance there and then we've got this gap to fill up here at about 1950 which is where I think we can potentially had as long as we hold that 1750 level that is just below us next we're going to cover the GoPro chart here and GoPro finally has I think established a real bottom so and what I mean by that is we sustain these lows here we also broke over this resistance you can see right there's that resistance there's read that resistance right here there's that resistance and we also did so look at all this volume right here so not just this breakout here on this day right here but we did so also on that day and then the following days as well you can see here's the average volume down here you can see all these days are like double the average volume or triple the average volume you know if you look at the weekly chart you can see it a little more clearly right here and look at this just breaking over that 50 week moving average right here for the first time since over here obviously we failed the last time but to me this is a better setup and I think that you know we could see some strength here on GoPro some strength that you know could last you know more than just you know a week or two like it kind of has in the past so I'm definitely changing my stance here on GoPro the and you got a change as price changes as well so definitely looking for some higher prices the other thing that you want to point out or that you want to look at as well is you can see that we traded sideways here for pretty much a year you know look at all these candles right here just train rare very small candles high and tight price and then look at this breakout we're finally breaking out of this range here really think that we could be looking at a big-time breakout here on GoPro in the long run so looking for some higher prices on GoPro got some support at about 1090 to me this is going to be that level that I won't go pro to stay above so as long as GoPros above 1090 I'm bullish if it's below 1090 I'm not necessarily bearish but I want to see it you know sustained over 1090 in order to remain bullish so you know keep in mind you know you can always re-enter a trade so there's a lot of misconceptions about you know keeping your stops tight which is keeping them lower well if you keep your stops tight yeah you're gonna get stopped out you can always get you can always re-enter that trade all right so would you rather get stopped out you know five times at 1094 30 cent loss or would you rather get stopped out you know once four down here at $9 for you know a $2.00 loss you know that's the difference okay so you can take these small paper cuts versus a big huge woo - if you sold down here at 9 so just kind of going over a little example here again I'm bullish on GoPro as long as it's over 1090 so the next one I take a look at is Tesla and Tesla this is one that we covered here last week and we called for higher prices on tests left we broke over this trendline we got that with some nice big volume right here this is exactly what you want to see we're coming into the target here at about 384 based off of this previous resistance up here so I definitely think it's going to react to that level and potentially take some kind of a pause it's definitely not you know a short that I would take but it's just something to be aware of you know for maybe some short-term options traders that you know have to deal with data and time decay you know maybe it's some profit-taking area would be a good area up here at 384 so just be aware of that if we do end up coming up here and then getting rejected and coming back down to me this is just a good re-entry down here at about 360 you know we've got this big trend line right here started in March got abouts there there right there several bounces here and we can just extend that keep extending and you can see it matches up perfectly there I'm going to extend that downtrend line so if we head lower after getting rejected here two means a great buying opportunity that they're both that will act as support as well so some nice levels below us if we do head lower for a nice bounc to me you know this is not great action that we saw on Friday we ended up actually on Thursday as well so you can see this gap down here on Thursday close below the previous day's low and then right here on Friday we are going to closing below this trendline as well with some heavy volume okay so this doesn't look great for Google but what I want to kind of present to you is if we get a gap up tomorrow and a break of Friday's high so Friday's high was nine forty one seventy five so nine forty one seventy five we break that to me this is going to be a great long signal you know Google is quite a bullish stock overall and it tends to kind of fake out the short side traders so yes it looks weak here we had some heavy volume come out of it you know we got rejected that the downtrend line will below this support below the 20-day moving average so more than likely we're gonna head lower but if we get a gap up and a break over that previous day's high to me that's gonna be a really really nice long signal as that is going to be considered a false break down false breakdowns lead to big moves to the upside so no bias either way for me I have no position on Google right now but to me if Google breaks previous day's high after a gap up to me that's gonna be a nice long signal as I think if it does happen it'll come up here and hit about 972 975 so keep an eye out for that if it doesn't gap up and break over that leveled and most likely it's going to come back down and come down and test this support down here so Monday's action is going to be critical to where Google heads in the future next one I take a look at Netflix and Netflix you can se with resistance previous support there there and now turning the resistance you can see that broke over and right here so if we do head lower into about 179 180 to me that's a buying opportunity we've got the twenty day and 50-day moving average coming up together that'll active support so definitely be looking for that level here on Netflix the next more let's take a look at is Facebook and Facebook this one you know kind of just trading sideways for basically two months now ever since this gap up on earnings as you can see hasn't really gone anywhere since that since that happened so is this building up energy for a move higher or is it building up energy and distributing price up here for a move lower I really don't know I don't have a crystal ball but what I can tell you is you can play with two different levels so if we crack 174 it's going to be a breakout higher and it's gonna break out much much higher if we crack about 165 that's going to be a crack lower and we're gonna head down to about 155 alright and you can clearly see you know even if we head down to 155 you know this is still nothing on the blip of this extremely bullish stop so even if we do a head lower still very bullish but but just kind of be aware of these two main levels 165 174 pay it's under these two main levels on Facebook and you're going to do just fine the next one is Amazon and Amazon is nesting really nicely here above is support so here we are had this resistance there there here here we broke over it right here on Wednesday and then Thursday and Friday we just saw some really nice calm inside days of this breakout date so what I mean by inside is you know this day traded inside the high and the low this day and this day as well inside the day of this breakout day as well so we're kind of just consolidating building up energy for the next move higher at least that's the way that I'm seeing it as I do think that Amazon is going to get a bounce off of this level and then head back up to about 10 20 so just like Priceline Amazon and Google as well gapped down huge on earnings right here and you saw three days in a row right here with some big selling volume right here and we're still below those loves all right we're still below those levels here so just kind of want to point that out that those levels are still gonna be that's still a bearishness that we have to kind of deal with and be prepared for not saying that amazon is going to come down after hitting those levels but just something to kind of be aware of let's keep it in the back of our heads to see kind of how we react you know if we come up here on Amazon and we hit this level up here and we get some high volume inverted hammer you know an inverted hammer if you don't know it's basically you know the opposite of a hammer so here's a hammer right here came down and then bounced off support and then had this long buying tail at the bottom so same kind of action as these right here and you can clearly see how when we came down we created these buying tails we ended up heading much higher after there so if we see that happen maybe a break over this resistance here and then a rejection here back underneath it that's going to be a short signal so again why don't it buy have a crystal ball I don't know if that's gonna happen I'm just kind of pointing it out giving you some kind of a plan to work with something to look for in the future for a potential thing to happen all right I want to put on a couple of things here on Apple we broke this trendline you can see and this is again not a huge trend line it's only been valid since July so you know this isn't some huge breakdown alert on Apple or anything like that but you know something to note here we did break this short-term trend line here's a balance there's a bounce here's the bounce and then we tried to break below it here and then end up kind of puttering out at it right here and obviously we're below it right here and you can see right here on this day this was the iPhone event day you can clearly see that was a engulfing day here with some heavy volume right here and the second day as well had some heavy volume as well but and to me those days kind of showed some weakness here but then you had on Friday you had another heavy volume day that was heavier than this volume day still not as high as this volume day but a green day that ended up closing over the previous day's high so I kind of have mixed feelings about Apple to me kind of go either way obviously longer-term there's a very bullish stock here so you got to give the kind of the points to the Bulls here the benefit of the doubt rather to the Bulls here but we're still below this trendline and another thing too is we have this resistance here ended up closing back hundreds so to me is kind of you know a clear rejection of this price level up here so we'll kind of see what happens I know I'm being kind of vague on Apple but you know this really just how I'm seeing it I don't have a position on Apple so just kind of throwing that out there and I don't really plan on it just because of you know I I feel like I don't have a great read on Apple based off of you know the mixed signals that I'm getting on on this stock so we'll see what happens clearly there's a level right here that you want to focus on as a near-term level of support I'm gonna draw that right around 158 you can clearly see you know boom boom boom here three days in a row where that was the low so if that level breaks then I think that Apple is gonna head down to about 154 all right so 158 breaks and we're gonna head in to 154 that's a break big big big if all right so pay attention to these levels here and you're gonna do just fine alright a thing or two from this video and thank you for stopping by once again once you do that in the market





Comments 0