
저자: 미상 · 한국인
요약 보기
SOXL이 삼각수렴 하단과 지지선을 하향 돌파해 단기 반등보다 추가 하락 가능성을 점검해야 하는 국면이라고 봄. 일봉 RSI 40, 피보나치 0.618 최소 조정 확인. 240분봉에서 헤드앤숄더 패턴과 RSI 과매도 진입 언급. 추가 조정 시 462 부근, 120선 접점(약 450)이 매수 매력 구간이며, 최악의 경우 고점대비 66% 하락한 100달러 수준까지 언급. 고점 250~300 부근 매수 금지 주장.
다듬은 글
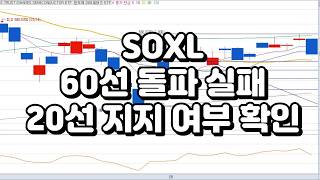
SOSX eventually left the electronics store . Instead of a rebound, a downward breakout occurred from the triangular convergence point I have been mentioning for the past few days . Below, the 60-line and the previous low were holding, while above, the downtrend line continued to press down on the stock price .
However, that support line was broken today. The market has now entered a phase where we must look for the possibility of further decline, rather than a short-term rebound. Today, I will summarize how far SOL might correct after the SOSX downward breakout and why you absolutely should not place a heavy position right now .
hello. I am a SOSL analyst. This is the 3-minute SOXL analysis video I watch every day. For the past few days, I have been explaining inflection points that serve as opportunities for a short-term rebound, while simultaneously being positions where a decline is possible when viewed on a larger chart .
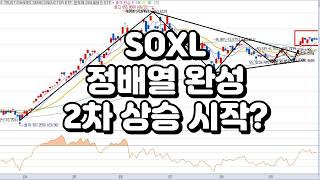
The stock price has clearly broken below the bottom. Now, I need to check where it can stop and rise again . First, let's take a broad look at the chart. The current daily RSI is 40. It falls into the lower range. If you look at the RSI of the past daily charts below 40, you just need to confirm that a rebound is quite possible.
And the point to look at is Fibonacci. During that time, the minimum correction range, which is the 618 position of 0.618 in the wave pattern, did not appear. I said that the adjustment should come out at least this much . Currently, in the small wave, it recorded 0.618 . It would be a better situation if it came down to around 0.5, but the fact that it has at least made a minimal correction is positive for the future rebound of SOSL.
Rather than stocks that rise endlessly, you should choose stocks that are volatile, experiencing both corrections and gains. Only then can you buy at a good price and sell when it rises again. When SOSL surged to 250 or 300, it was a position where you absolutely should not buy . Next, let's take a look at the big wave.
The minimum correction range in a large wave is 462. In the 462 position, there is also a small space for support. The spot where the 120 line meets the spot around 450 that I have mentioned several times. If it comes down to that level, it reaches a point where it is really worth buying. However, stocks tend to go up when they rise and down when they fall.
It could drop to the 120 mark in one fell swoop, but we also need to consider the possibility that it won't. Let's look at the small wave again. There is also a strong possibility of a rebound as it drops to the current level or 0.5% . The RSI has dropped below 40, and given that a decline of about half the wave that has continued since March has occurred, a retracement rebound is likely to happen even if it does not necessarily reach the 120 line .
For retracement rebounds, you need to identify entry points more precisely on the minute chart. This is the 240-minute chart. The stock price has clearly broken below its low point, and a head and shoulders pattern is clearly visible. If you look at the RSI, the high trend has continued to come down to the 50 level, and the low also falls below 30, entering the oversold zone for the first time.
For the first time since March 30, the RSI oversold zone is noticeably appearing. In summary, while the overall wave may still appear high, the minimum correction has occurred within the price wave that has risen since March 30. Although further declines are possible, the RSI is entering the oversold zone.
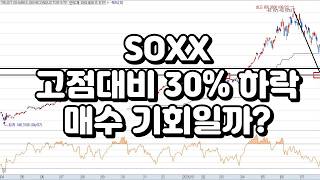
If further declines occur, it would mean half of the wave has fallen, creating a sufficient opportunity for a rebound. What we need to watch now is at what point the trend reverses and starts to rise. I said that only a short-term rebound could occur before the triangle convergence breaks, but if there is an additional correction from here and it falls to the high 400s, SOXL will drop to the $100 level.
Then, according to SOXL standards, it has dropped by as much as 66% from its peak . The opportunity to make a profit by carefully observing the trend and buying is approaching . You should n't just wait for a decline; you also need to know how to trade at key turning points . Then I will see you next week. Thank you for your effort



Comments 0