저자: 미상 · 외국인
요약 보기
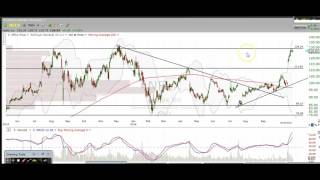
이 영상은 2016년 10월 27일 기술적 분석 영상으로, 애플·테슬라·넷플릭스·마이클 코어스·GM·보잉을 차트로 분석한다. 애플: 실적 발표 후 목표가 118 부근에서 이익 실현했다고 밝혔다. 현재 하락 추세를 전제로 117달러대 또는 118.50달러 재테스트 후 112달러 이하까지 추가 하락을 예상하며, 이후 반등 가능성을 언급했다. 테슬라: 실적 발표 후 시간외 거래에서 긍정적 반응을 보였고 약 211달러 부근이다. 추세선은 상회했으나 200일 이동평균선과 216달러 저항을 넘어야 본격적 상승으로 볼 수 있다고 했다. 돌파하지 못하면 하락할 가능성이 크다고 판단했다. 넷플릭스: 129~130달러가 반복 저항선이며 최근 며칠간 이 구간에서 거부당했다고 설명했다. 롱 포지션의 일부 이익 실현을 고려할 구간이라고 제시했다. 마이클 코어스(KORS): 하락 추세선과 200일 이동평균선 아래에 있어 하락이 예상된다. 42~50달러 갭 메우기를 목표로 보며, 51달러 상향 돌파 시에만 강세 전환으로 본다. GM: 실적 발표 전 거짓 돌파 후 실적 반응으로 하단을 이탈했다. 하락 추세 지속과 200일 이평선 이탈 가능성을 보며, 27.50달러 부근까지 하락할 수 있다고 언급했다. 보잉: 상승 돌파 후 137달러를 지지선, 149달러를 저항선으로 제시했다. 두 레벨을 기준으로 거래하면 된다는 입장이다. 전반적으로 발언자는 애플·코어스·GM의 하락, 테슬라의 216달러 돌파 여부 확인, 보잉의 상승 흐름을 제시했다. 정확한 가격 목표와 조건부 시나리오 중심의 기술적 분석이며, 구독 서비스 홍보가 포함되어 있다.
다듬은 글
everal charts here and I'm going to go over my analysis and thought process and the idea here is for you to come away from this video with some extra stock be able chat room but also via text message and email for those of you that can't be in the chat room all day long totally understand you're not going to be able to miss those alerts because we give them to you via text and the webinars plus going with these charts the first one we want to take a look at is Apple and Apple as we've been mentioning downside is likely and that's exactly what we got off of these earnings here we hit our Target right here at about 118 and we took profits from our long that we got down here very nice trade here for our members and we've been calling for lower prices since we broke this little mini trend line here and couldn't break over this resistance that's exactly what we got off of those earnings and as you can see we bounced here off of the lows and we believe that Apple will continue to the downside it may want to retest a little bit higher maybe up into the 117s maybe even retest the 11850 Mark again but eventually it's going to retest those areas and then head lower down to this trend line This is a support level from these previous highs and then we also have this uptrend line right here so I believe that uh Apple is going to be heading lower still um and retest at least 112 uh before potentially uh getting a bounc and Tesla had a positive reaction to earnings right now in the after hours it closed at about 2 is where it's at right now this is the 15minute chart right here and it's not yet reflected Ed um on the daily chart so it's right around 211 so it's over this trend line but it's not yet over these highs over here so really I wanted to see it uh break above uh 2115 uh 26 in order for this to really get a real bullish move as long as we're below that level and below the 200 day moving average we're probably going to head lower here so look for that to happen tomorrow um either a break over this uh trend line and the 200 day and this 216 Mark um but if it doesn't really break over that we're going to be heading lower here it had its opportunity on this earnings uh to do so so just be aware of of kind of the levels on the chart and is coming up to this resistance it's hit it several times about 129 to 130 it was these previous highs in August of 2015 and then December of 2015 and then look at where we got rejected at for the past several days right here definitely an area to be considering taking some profits on some Longs uh we are at a very key level here on Netflix we'll see if it can break over um but definitely an area that you want to be aware of here on the Netflix chart because it is very key the next one we're going to take a look at is Kors and Michael Kors K RS and I do think that this one looks like it's headed down as well I'll zoom out here we've got these downtrend lines I'll show you the weekly chart here so we are in a downtrend several touches here on this one here there and then this downtrend trend line right here you can see that all meeting up in the same spot and then we broke this little mini uptrend here there's a touch several touches there's a touch we broke it right here and then you can see we came up and got rejected at both of those retests right there so I'm looking for Kors to be heading lower here we're also below the 200 day moving average so that's going to act as resistance as well more than likely we're to at least test these lows right here more than likely fill this gap down here at about 42 uh 50 right there so look for that on Coors if we end up breaking over and holding over 51 that's going to be a bullish breakout here for KES but until it does that we've got major resistance above and we're below this trend line so definitely look like uh we're going to be continuing to the downside the next one we're going to look at is oops not uh CMG but uh General Motors here and General Motors you can see that we have a false breakout yesterday I'm sorry not yesterday two days ago before the earnings announcement and then we had the reaction to earnings here broke below the lows of that breakout candle right there you can see we made another lower low and lower high right here I believe this trend will continue and that we will eventually break this 200 day moving average and head lower potentially to these lows down here at about 2750 this should not be uh understated right here right here we broke out to the upside it looked like a breakout but it ended up breaking down to the downside there's a saying that goes false moves lead to Swift moves in the opposite direction so this is the false move up and we're going to see a swift move in the opposite direction that's usually what happens not a 100% but that's what happens most of the time next one we're going to take a look at is Boeing Boeing I have been posting these bullish charts here on social media so congrats if you've been following along with those charts very very nice breakout here for Boeing this is going to be support now uh right here about about 137 is going to be that support and then the resistance we're going to have I'll draw this for you right up here at about 149 right here you can see look how many times we got knocked into that resistance right there if you scroll back over here right there right there as well so the resistance is not that far away it's definitely an area that you want to be aware of but if we retest lower before or higher definitely looks like we can get a bounce from that level so you need to be aware of these two levels 149 137 and you should do just fine here on this Boeing trade thanks for stopping by appreciate it as always if you scroll down a little bit further you can see what the current members are saying about the membership the best part is once you sign up you're going to be able to get those profitable trade alerts that we give to our members on a regular basis it's a great opportunity we'd love to have you





Comments 0