
저자: kimsstock · 한국인
요약 보기
미국 증시가 고점 조정 후 상승 추세가 재개된다는 진단. FOMC 금리인하(25bp 이하, 50bp 8%) 기대가 시장에 선반영돼 상승을 이끈다고 봄. 유나이티드헬스, 팔란티어, 엔비디아, 오라클, IBM, 넷플릭스, 애플(단기 조정 후 반등), TSMC, 코인베이스, SOXL 등 개별 종목 차트 기반 매수 구간·목표가 제시. 대부분 기술적 지지선·골든크로스 근거.
다듬은 글
, September 10, 2025 . It is before the market opens on Wednesday, September 10, U.S. time. . It gives me great strength to continue uploading videos . thank-you com.37% to 37% . Now, I explained that a golden cross could occur in the long-term indicators, right? Yesterday, it showed signs of rising again while Nasdaq futures index, a new uptrend is starting as it breaks through the upper downward line, ce again.
Now, however, you should still be a little cautious for a day or two gain. Therefore, please assume that the market might show a slight lack of strength for a day or two. Since the overall trend is upward, do not get too carried away by daily fluctuations; just hold onto the stocks you accumulated at the bottom .
Now, yesterday, the U.S. Bureau of Labor Statistics lowered its employment growth forecast . However, it was an already anticipated scenario, and as the market accepted this as the resolution of uncertainty, it maintained the upward trend. Now, it is already being taken for granted in the market that the September FOMC meeting will likely result in a cut of 25bp or less .
And there is also an 8% chance of a 50bp cut . In addition, the possibility of further price cuts in October and December is currently being highly reflected in the market, and you can view this expectation as driving the market upward. Now, first of all, yesterday Uniteds Group projected the proportion of top-tier insurance policyholders to reach 78% next year, reflecting expectations for increased government subsidies.
At the same time, it showed an increase of about 8.6% and 6% . This is content that has already been posted. Now, let's take a look at United Health Group first. Now, in the United Health Group video from September 4th, I explained that the yellow lime line is gradually rising, and that when the yellow and green lines cross, another rise occurs .
That is why I shared the buying point in advance through a revelation. As signs of a rebound emerged from this flat support line, I took the Lestar point, and it is currently showing a rise of about 10% . Okay, I set the goal up to the brown line, right? Now, you can consider that the first target has been reached.
However, since Warren Buffett’s Berkshire Group recently purchased over 5 million shares of United Health Group and is taking a long-term view, you can assume that a long-term upward trend could certainly emerge again . Now, for those looking at the short term, if the price falls below $345, you can take a profit.
For those looking at the long term, if you look at the price along the red line, you can consider this a zone where you can set a target of $450 and take your position . Now, I will help you safely make big profits from these large-cap stocks in their bottoming phases . Now, next, let's take a look at Palantir Tech .
Okay, okay, Palantir Tech also showed a rise of about 4% yesterday, and right now it is showing an additional 1.2% to 2% increase. Now, regarding Palantair Tech, we have already entered our first buy position near the green line. Now, let's look were flat, but they have turned slightly toward an upward direction .
Now, short-term and medium-term indicators are already showing an upward trend . Now, assuming this happens, it can be seen that the possibility of going straight up without the brown line being given has increased. Now, of course, if it reaches the brown line, you can consider that I am preparing for a second purchase.
Now, the primary support line is near the green line. I've mentioned this a lot during class as well. Now, for good stocks like this, you need to accumulate them whenever a support line appears . Now, let's take a look at Apple. Now, with the announcement of Apple's new products, it showed a decline of about 1.5% yesterday .
Now, as I already mentioned in the second video, said above that a slight correction to the yellow line might occur when the new product is announced . Now, there is a world of difference between someone who takes the stock knowing it will fall and someone who faces the drop without knowing. Now, first of all, there are evaluations that the AI feature updates in Apple's new product announcement were insufficient, and with AI mentioned only five times during the presentation, it can be seen as having fallen short of investors' expectations .
Now, of course, you can view this as just one event. You can consider Apple's trend to ultimately be upward, and I expect it to show another upward trend after a slight event . Now, during such a period, short-term indicators need to drop to the bottom zone. Now, in terms of the timeframe, I am looking at about 3 or 4 days .
It seems like it could hit the bottom of the short-term indicators in about 3 or 4 days, rise again, and then form a support line for 3 or 4 days before starting . Now, next, let's watch Netflix. Now, Netflix also already took a buying point when it broke through. You just need to make a first purchase near the yellow line and a second purchase when it reaches the brown line.
However, it is currently rising after hitting a double bottom near the initial level. This is why you must always buy in installments . Okay, for now, we are looking at a long- term target price of $1,400 . Of course, if the situation changes along the way, I will share the selling entry points again .
Right now, the short, medium, and long term are all on an upward trend . Now, let's take a look at the video . Now, Nvidia also showed a rise of about 3% yesterday from the primary support line near the green line I mentioned . Short-term indicators have accurately bottomed out and are showing signs of a rebound.
Now, the mid-term indicators are showing a slightly flat trend, and the long-term indicators are also showing a slightly flat trend . For now, it seems more likely that it will rise directly from near the green line rather than drop to the brown line, and based on the brown line, you should be prepared for a second purchase at $145 .
Now, you can consider that it is moving exactly as we see in the big picture . We previously identified a buying point around $50, followed by a significant rise, and you can view the current section as showing an upward trend within its third trading range . Most brokerage firms have set their target at $200.
Now , let's take a look at Oracle . Now, Oracle is showing a rise of nearly 30% at this time . Well, first of all, first-quarter revenue fell slightly short of the consensus . However, Oracle stated that it is currently showing a very significant increase as its RPU child fulfillment obligations have more than tripled from $138 billion in the previous quarter to $455 billion in this quarter, and that it expects to sign new contracts worth billions of dollars in the coming months.
Now, the market is viewing this very positively as it demonstrates confidence that future revenue is already secured through contracts. Now, I explained last time that in the case of Oracle as well, the green line can serve as a primary support line. It continued to rise significantly Oracl $300. Until the, regarding IBM, I have been continuously sharing buying points at the bottom line of this major uptrend.
Well, it continued to rise by about 3% on Monday and showed an additional 1.3% increase yesterday, breaking through the primary resistance line, the brown line . Now, we can see that the next target price we are looking at is $265. Long-term indicators are currently rising in a very strong , you can view it as undergoing a slight correction again at the upper line of this upward trend, but the big picture is still .
Therefore, rather than selling at this level, you should view it as continuing to accumulate by buying again when it reaches the bottom. Currently, the medium-term indicator is staying near the green line and rising in an N-shaped upward wave. Okay, there is a stock to enter today as well. Now, looking at the minute chart, it is showing signs .
Now, I will share it with you through the Part 2 video and revelation . So, in the second part of the video, I plan to analyze the Bitcoin chart, and I will also analyze the items listed below. SNP 500, TQQ, Jobie Amation, Airen, Broadcom. Please make sure to watch the video as well, and I hope you can catch the .
Okay, everyone who watched the Meserado video knows, right? I mentioned that after finishing the downtrend, it is in a rebound zone , I mentioned that the area near the yellow and green lines could serve as a support line, and the price is rebounding exactly as the lower wick touches the yellow linl on an upward trend.
Sella had already gathered them near the yellow line when she was selling quacks. Now, let's take a look at IonQ . Now, I explained that Aion is heading towards the upper line of this box range, and that it will take a short break while climbing . Now, as of yesterday, it can be seen as having dropped one month for a slight pause, and with a rise of about 6.5% yesterday, looking at the upper price line, you can view it as heading back up toward $48.
Long-term indicators are on a strong Rigetti Computing is also showing an upward trend while continuing to hold the lower line of this major uptrend, and I also explained in the recent Part 2 video that it would hit the lower line again and go up . Now, it showed a rise of about 7.3% yesterday, and with long-term indicators currently flat, I expect it could form a golden cross again as early as this week or at the latest next week .
Okay, we can set the target price at $18 . Amazon.com is riding this upward trend, and that it is moving up from the bottom line toward the top line, and then back up again toward the top line . Now, since the medium-term and long-term indicators are on an upward trend, don't try to take too big; this is a zone where you can hold onto the stock.
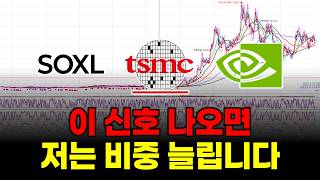
Now, let's take a look at Meta . Now, Meta is also drawing this upward trend and always shows charts similar to Amazon and Meta. You can view it as going up again from the bottom line towards the top line. You can view this as meaning that the possibility of another rise is still alive, wi . Okay, SOXL showed a rise of about 0.3% yesterday, and we are once again looking at our primary target of $29.
So, if it continues to rise until today, a golden cross will occur resume an upward trend . Now, looking at the SOX chart in more detail, I explained that it is supported by the green line and has the strength to rise to the yellow line. Now that it has risen to the yellow line, the line it needs to break through is around $252 the $252 resistance overlaps with the current overbought zone of short-term indicators, suggesting that the area around $252 could serve as a defense line.
Now, let's take a look at News Power. Now, News Power showed a 4% gain yesterday, and is showing an additional 2.5% yesterday's video, I predicted that it would go up while holding the lower line of this upward trend. Now, the reason for that is that the bottom zone of the short-term indicator overlaps with the lower line of the trend line right now .
And anyway, even if News Power eventually falls, I ebound without trending by responding with a second buying round near the dark blue line and the red line . This is because long-term indicators are currently on I recently bought Bitmine Cashod again, and it showed a rise of about 1.8% yesterday. Since a golden cross has appeared in the middle of a short-term bullish indicator, assuming it does not break $38 for BitMine to remain open .
Now, let's take a look at Solana next . I explained that Solana 2x leverage is also rising by about 5%, and it still holds the potential to rise to the upper line of this large uptrend . Now, Solana's chart looks very good right now, so I hope you will proceed with your investment after watching the detailed analysis in Part 2 of the video .
Now, let's take a look at the Reserve AI. Now, Liv AI generated significant profits by accumulating throughout July and August, and yesterday it also showed a very large increase of about 21%. Now, for those of you holding Liiv AI, 4.9 dollars. Now, let's take a look at TSMC next. Okay, I explained that the green line could serve as a primary support line for TSMC as well .
I explained the possibility of it going up in an upward wave, didn't I? It is showing a new high rally as long-term indicators form a golden cross and to your position without needing to sell at all until $246 is broken. For those looking at the long term, if you bought near the green line, you only need to make a second purchase around the brown area, and until then, you can just keep holding .
Now , let's take a look at Coinbase Global . Now, I told you that there would be a big rebound on the day the Coinbase Global long-term indicator shows a golden cross . Now, I have been explaining that it would come out soon, and yesterday it showed a rise of about 5.5%, eventually showing a pattern of starting an upward trend above the brown line .
Now, first of all, when we say it rises until today, it means perfectly forming a support line and showing an upward trend. Okay, first, please aim for the primary target of $340. l rising. Now, let's take a look at the Core Weave . Now, Core Weave showed a rise of about 1% to 7.1% yesterday as the announcement of the establishment of a new AI startup investment fund had a positive impact, and is now showing an additional 6% f it breaks through this yellow line, Core Weave has room to rise to the green line at $125 .
showing a golden cross. Now, all of this vast information is is carefully before proceeding with your investment. If you do not look at Kim's Secret Note, it is like investing with your eyes closed . Okay, there is a stock to enter today as well . Now, this is a minute chart, and it shows the line breaking through the red and blue lines after establishing the G-line.
Now, I will share it with you through the Part 2 video and revelation . So, in the second part of the video, I plan to analyze the Bitcoin chart and analyze the items listed below. SP 500, TQQ, Joby's Mation, Airen, Broadcom. s well, and I hope you can catch some stocks that are at their bottom. Everyone, I hope you have a happy and enjoyable day today. To the with the Part 2 video and buy/sell posts . 습니다.




댓글 0